

Search for hr dashboard examples and you will find screenshots: colorful tiles, trend lines, a dozen gauges. Most come from software vendors, and most are built to show what a tool can display, not what a manager should do on Monday morning.
A useful people dashboard works the other way around. It starts with the decisions an owner or HR lead has to make: where to recruit harder, which team needs a manager conversation, when an exit pattern deserves a closer look. Then it picks the few metrics that inform those decisions and defines each one tightly enough that two people calculating it get the same number.
This article describes a one-page dashboard of ten metrics, with formulas, owners and review triggers. It also shows how to read your numbers against U.S. benchmarks, what to leave out and where privacy and legal questions come in.
Quick answer: A good HR dashboard is one page with eight to ten defined metrics across hiring, retention and employee experience. Each metric has a formula, a data source, one owner, a threshold and a named action. Small firms should track counts over a rolling 12 months, not monthly percentages.
Key takeaways
- Build the dashboard around decisions, not around what your HR software can chart.
- Start with ten metrics in three blocks: hiring, retention and experience. Add more only when a decision requires them.
- Write down a formula, denominator, period and exclusions for every metric, and always separate voluntary from involuntary exits.
- Compare your rates with BLS JOLTS data for context, but do not compare across industries or treat vendor rules of thumb as standards.
- Gallup data shows only 49% of U.S. employees strongly agree they know what is expected of them, so clarity of expectations deserves a place next to turnover.
- Small teams need counts and rolling periods. One exit in a 25-person firm moves monthly turnover by 4 percentage points.
- Limit who sees what. Have counsel review data cuts, retention and any automated tools before rollout.
What is an HR dashboard, and who needs one?
An HR dashboard is a single view of a small set of workforce measures, refreshed on a fixed schedule and reviewed by people who can act on it. It differs from a report dump in one respect: every number on it has an owner, a threshold and an expected response. Without those, a number is decoration.
Vendors usually split the idea into several dashboards. BambooHR lists seven HR dashboard examples: recruiting, employee development, employee performance, employee turnover, HR executive, DEI and gender pay gap. Its turnover dashboard tracks turnover, attrition percentage and turnover cost per employee. Klipfolio’s HR dashboard examples include an overview dashboard and an engagement dashboard that combines survey results, retention, sentiment and participation.
Those are sensible starting points for a larger HR team with an analyst. A firm with 30 to 300 employees rarely needs seven dashboards. It needs one page that the owner, the head of operations and the HR lead can read in ten minutes.
How company size changes the design
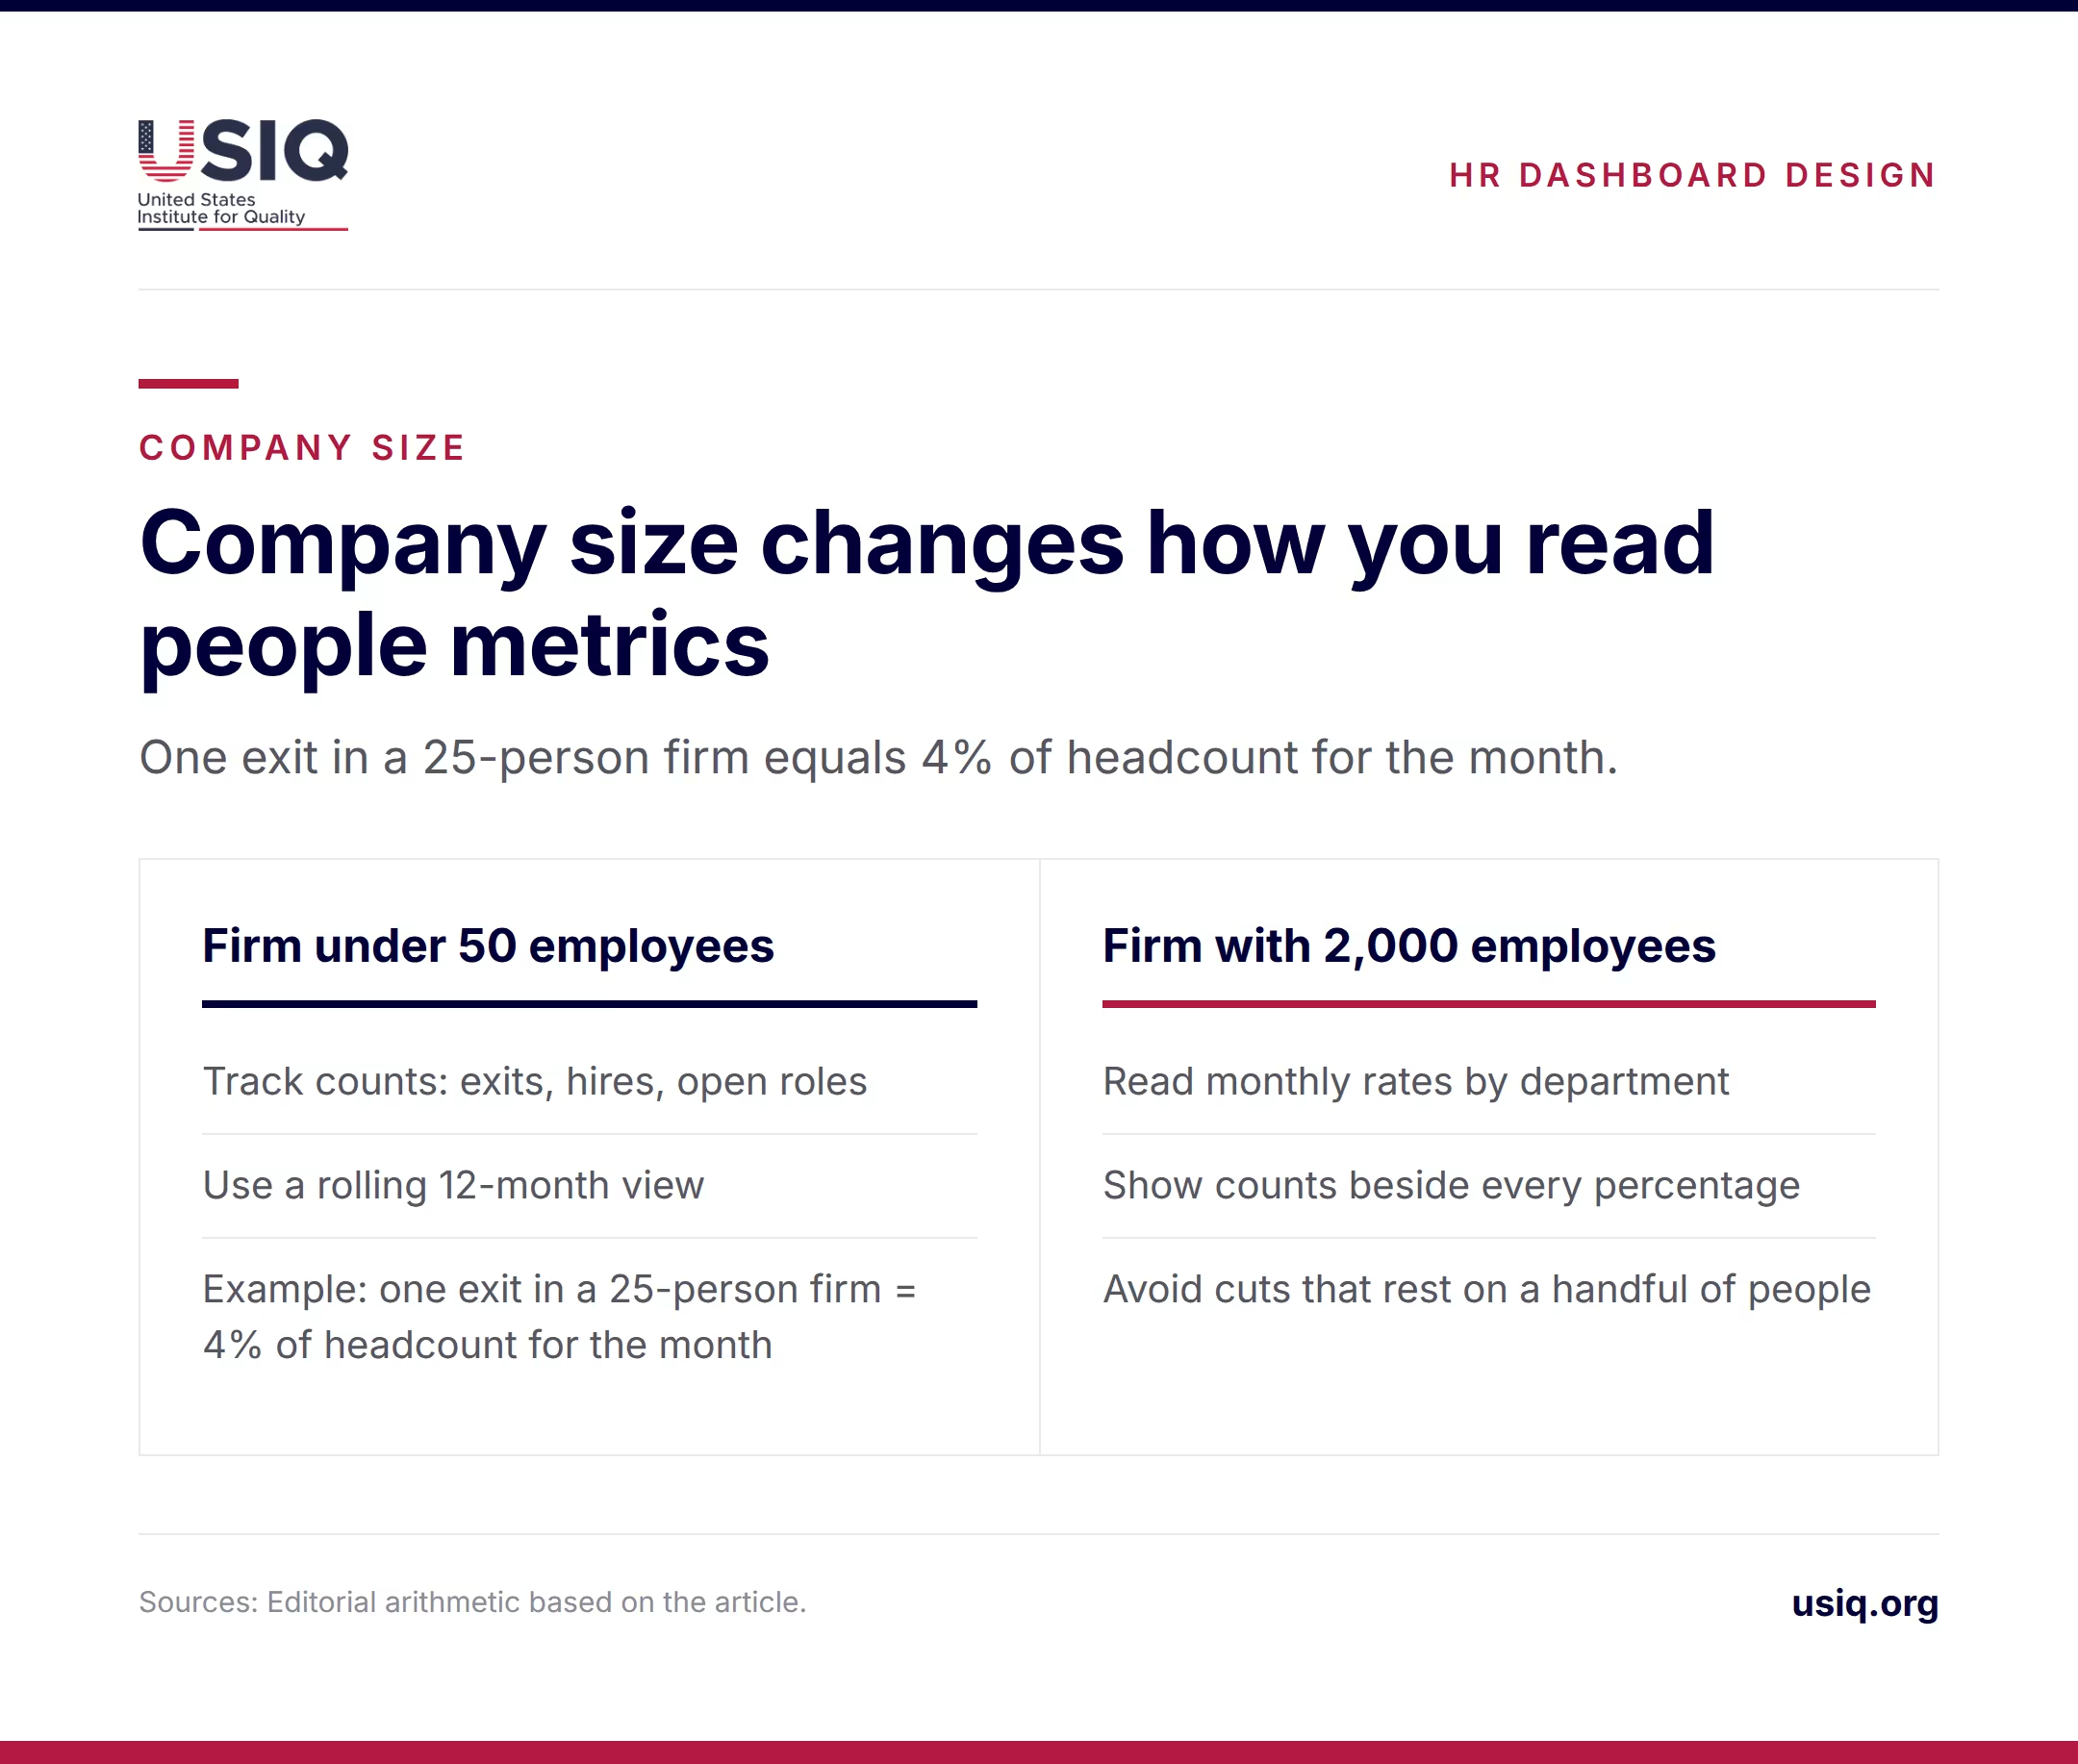
Percentages behave differently at different sizes. In a 25-person company, one resignation equals 4% of headcount for that month. A rate like that swings wildly and says little about a trend. Small firms are better served by counts (exits, hires, open roles) and a rolling 12-month view.
A 2,000-person firm can read monthly rates and split them by department, location or manager. Even then, small departments need care: a team of eight produces the same noisy percentages as a small company. Show counts beside every percentage and avoid cuts that rest on a handful of people.
Which employee experience metrics actually matter?
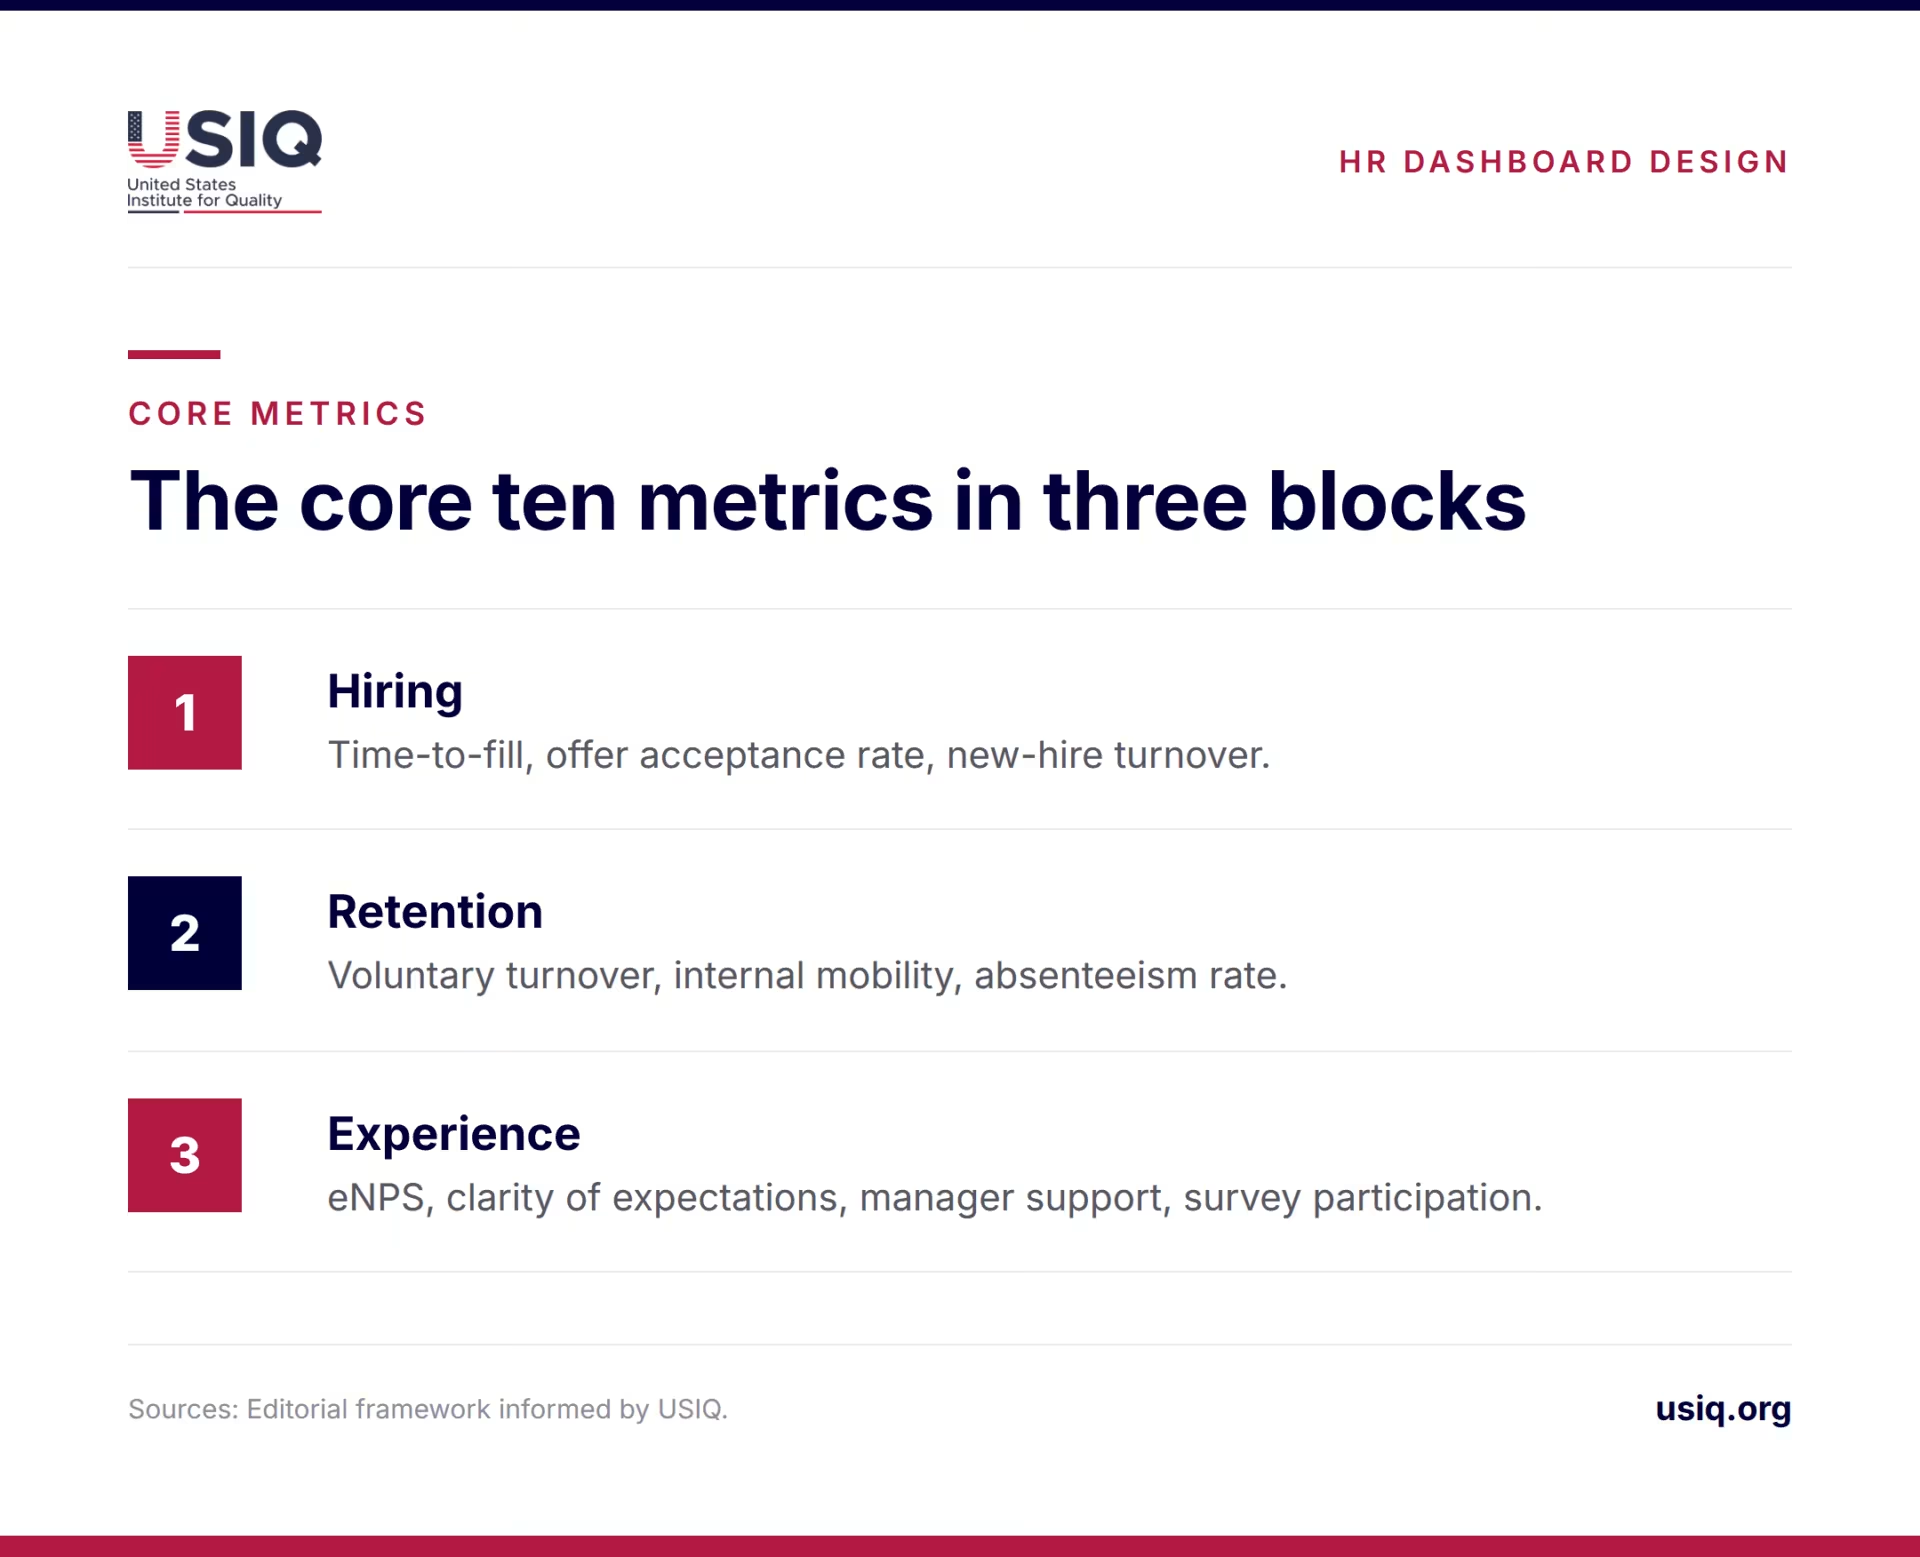
USIQ’s earlier piece on HR analytics and employee experience treats turnover, eNPS, time-to-fill, absenteeism and burnout, and learning and internal mobility as core measures. The ten metrics below turn that list into a starting set covering hiring, retention and experience, so the dashboard links how people are hired, how they feel and whether they stay.
The core ten
- Voluntary turnover. Employees who chose to leave, over average headcount, on a rolling 12 months.
- New-hire turnover. Exits within the first 90 days or first year, as a share of hires in that cohort.
- Time-to-fill. Days from approved requisition to accepted offer, by role family.
- Offer acceptance rate. Accepted offers over offers extended.
- eNPS. The employee Net Promoter Score from a short recurring survey question.
- Clarity of expectations. Share of employees who strongly agree they know what is expected of them.
- Manager support. Result of one or two survey items about feedback and support from the direct manager.
- Absenteeism rate. Days absent over total available workdays.
- Internal mobility. Promotions and transfers as a share of all filled roles.
- Survey participation. Responses over invitations, which shows how far to trust the three experience items (eNPS, clarity of expectations and manager support).
Why clarity of expectations? Gallup’s mid-2026 release reports that 49% of employees strongly agreed they know what is expected of them, up from 47% but well below the 61% peak in 2015. Gallup also reports declines in the share of employees who feel their opinions count and who feel connected to the organization’s purpose. Items like these tend to move before turnover does, which makes them useful early signals.
What to leave off at first
Several popular metrics add more work than insight at the start. Turnover cost per employee depends on assumptions that few firms document. Quality of hire needs consistent performance ratings and manager feedback, and it becomes workable only once those inputs are reliable. Wellness program use, training participation and recognition counts, which appear in Klipfolio’s metric list, make sense once a specific program exists and someone owns it.
DEI and pay-gap dashboards are a separate matter. They involve sensitive data and legal review, and they belong in a restricted view, not on the page the whole leadership team opens each month.
How should you define each metric so the numbers can be trusted?
Loose definitions are the most common reason a dashboard loses credibility. Turnover, attrition and retention get used interchangeably. One manager counts a contract end as an exit, another does not. The fix is a one-line definition for each metric, written once and kept with the dashboard.
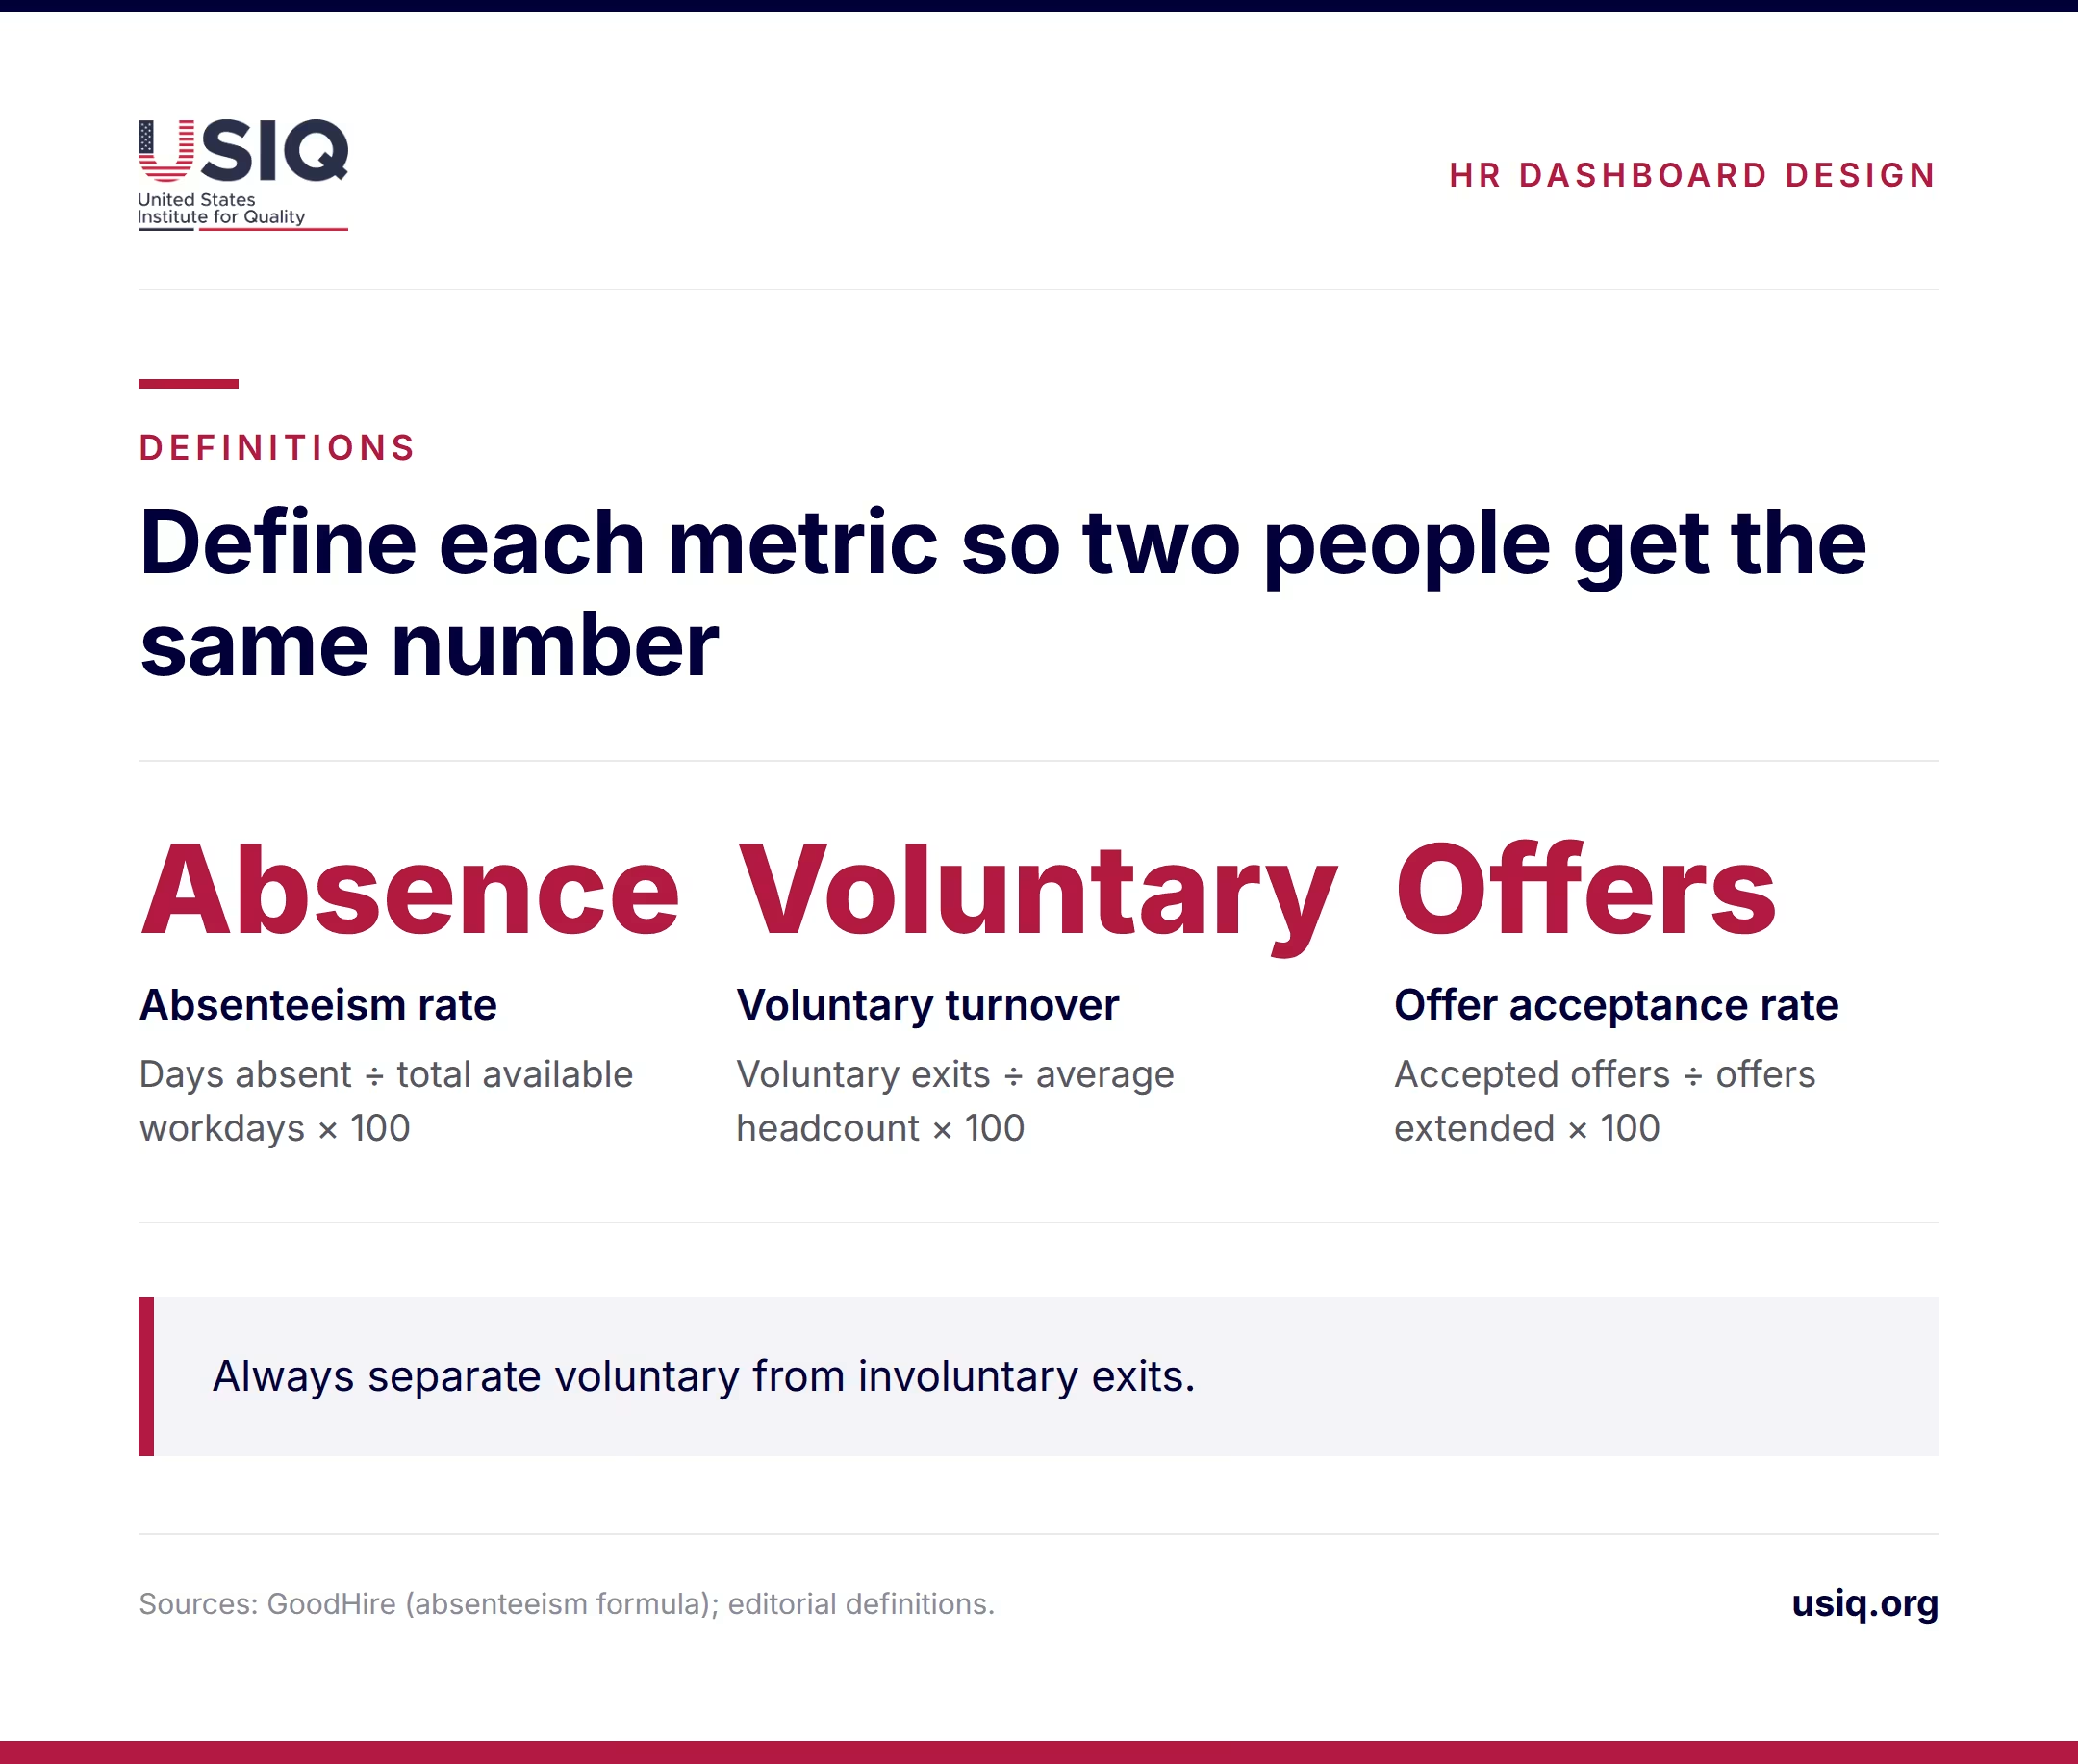
The most important single rule is to separate voluntary from involuntary exits. GoodHire’s guide to HR metrics for small and mid-sized businesses makes the same point. A resignation rate points to experience problems. A dismissal rate points to hiring, onboarding or performance management. Blending them hides both.
| Metric | Formula and denominator | Period | Exclusions to document |
|---|---|---|---|
| Voluntary turnover | Voluntary exits ÷ average headcount × 100 | Rolling 12 months | Involuntary exits, retirements if reported separately, end of fixed-term contracts |
| New-hire turnover | Exits within 90 days ÷ hires in that cohort × 100 | Quarterly cohorts | Seasonal roles with known end dates |
| Time-to-fill | Days from approved requisition to accepted offer (median) | Rolling 6 months | Evergreen requisitions, internal transfers |
| Offer acceptance rate | Accepted offers ÷ offers extended × 100 | Rolling 6 months | Offers withdrawn by the company |
| eNPS | Percent promoters minus percent detractors | Quarterly | Teams below the minimum response count |
| Clarity of expectations | Strongly agree responses ÷ all responses × 100 | Quarterly | Same minimum group size as eNPS |
| Absenteeism rate | Days absent ÷ total available workdays × 100 | Monthly, rolling 3 months | Approved leave types you decide to count separately |
| Internal mobility | Internal moves ÷ all roles filled × 100 | Rolling 12 months | Title changes without a role change |
The absenteeism formula in the table matches the one GoodHire gives: days absent divided by total available workdays, multiplied by 100. The other formulas are standard practice, but the exclusions are yours to set. Set them once and apply them every period.
For turnover, pick the denominator deliberately. Average headcount over the period (opening plus closing, divided by two) is the usual choice. Using only year-end headcount flatters a company that shrank and penalizes one that grew.
What do the best HR dashboard examples look like?
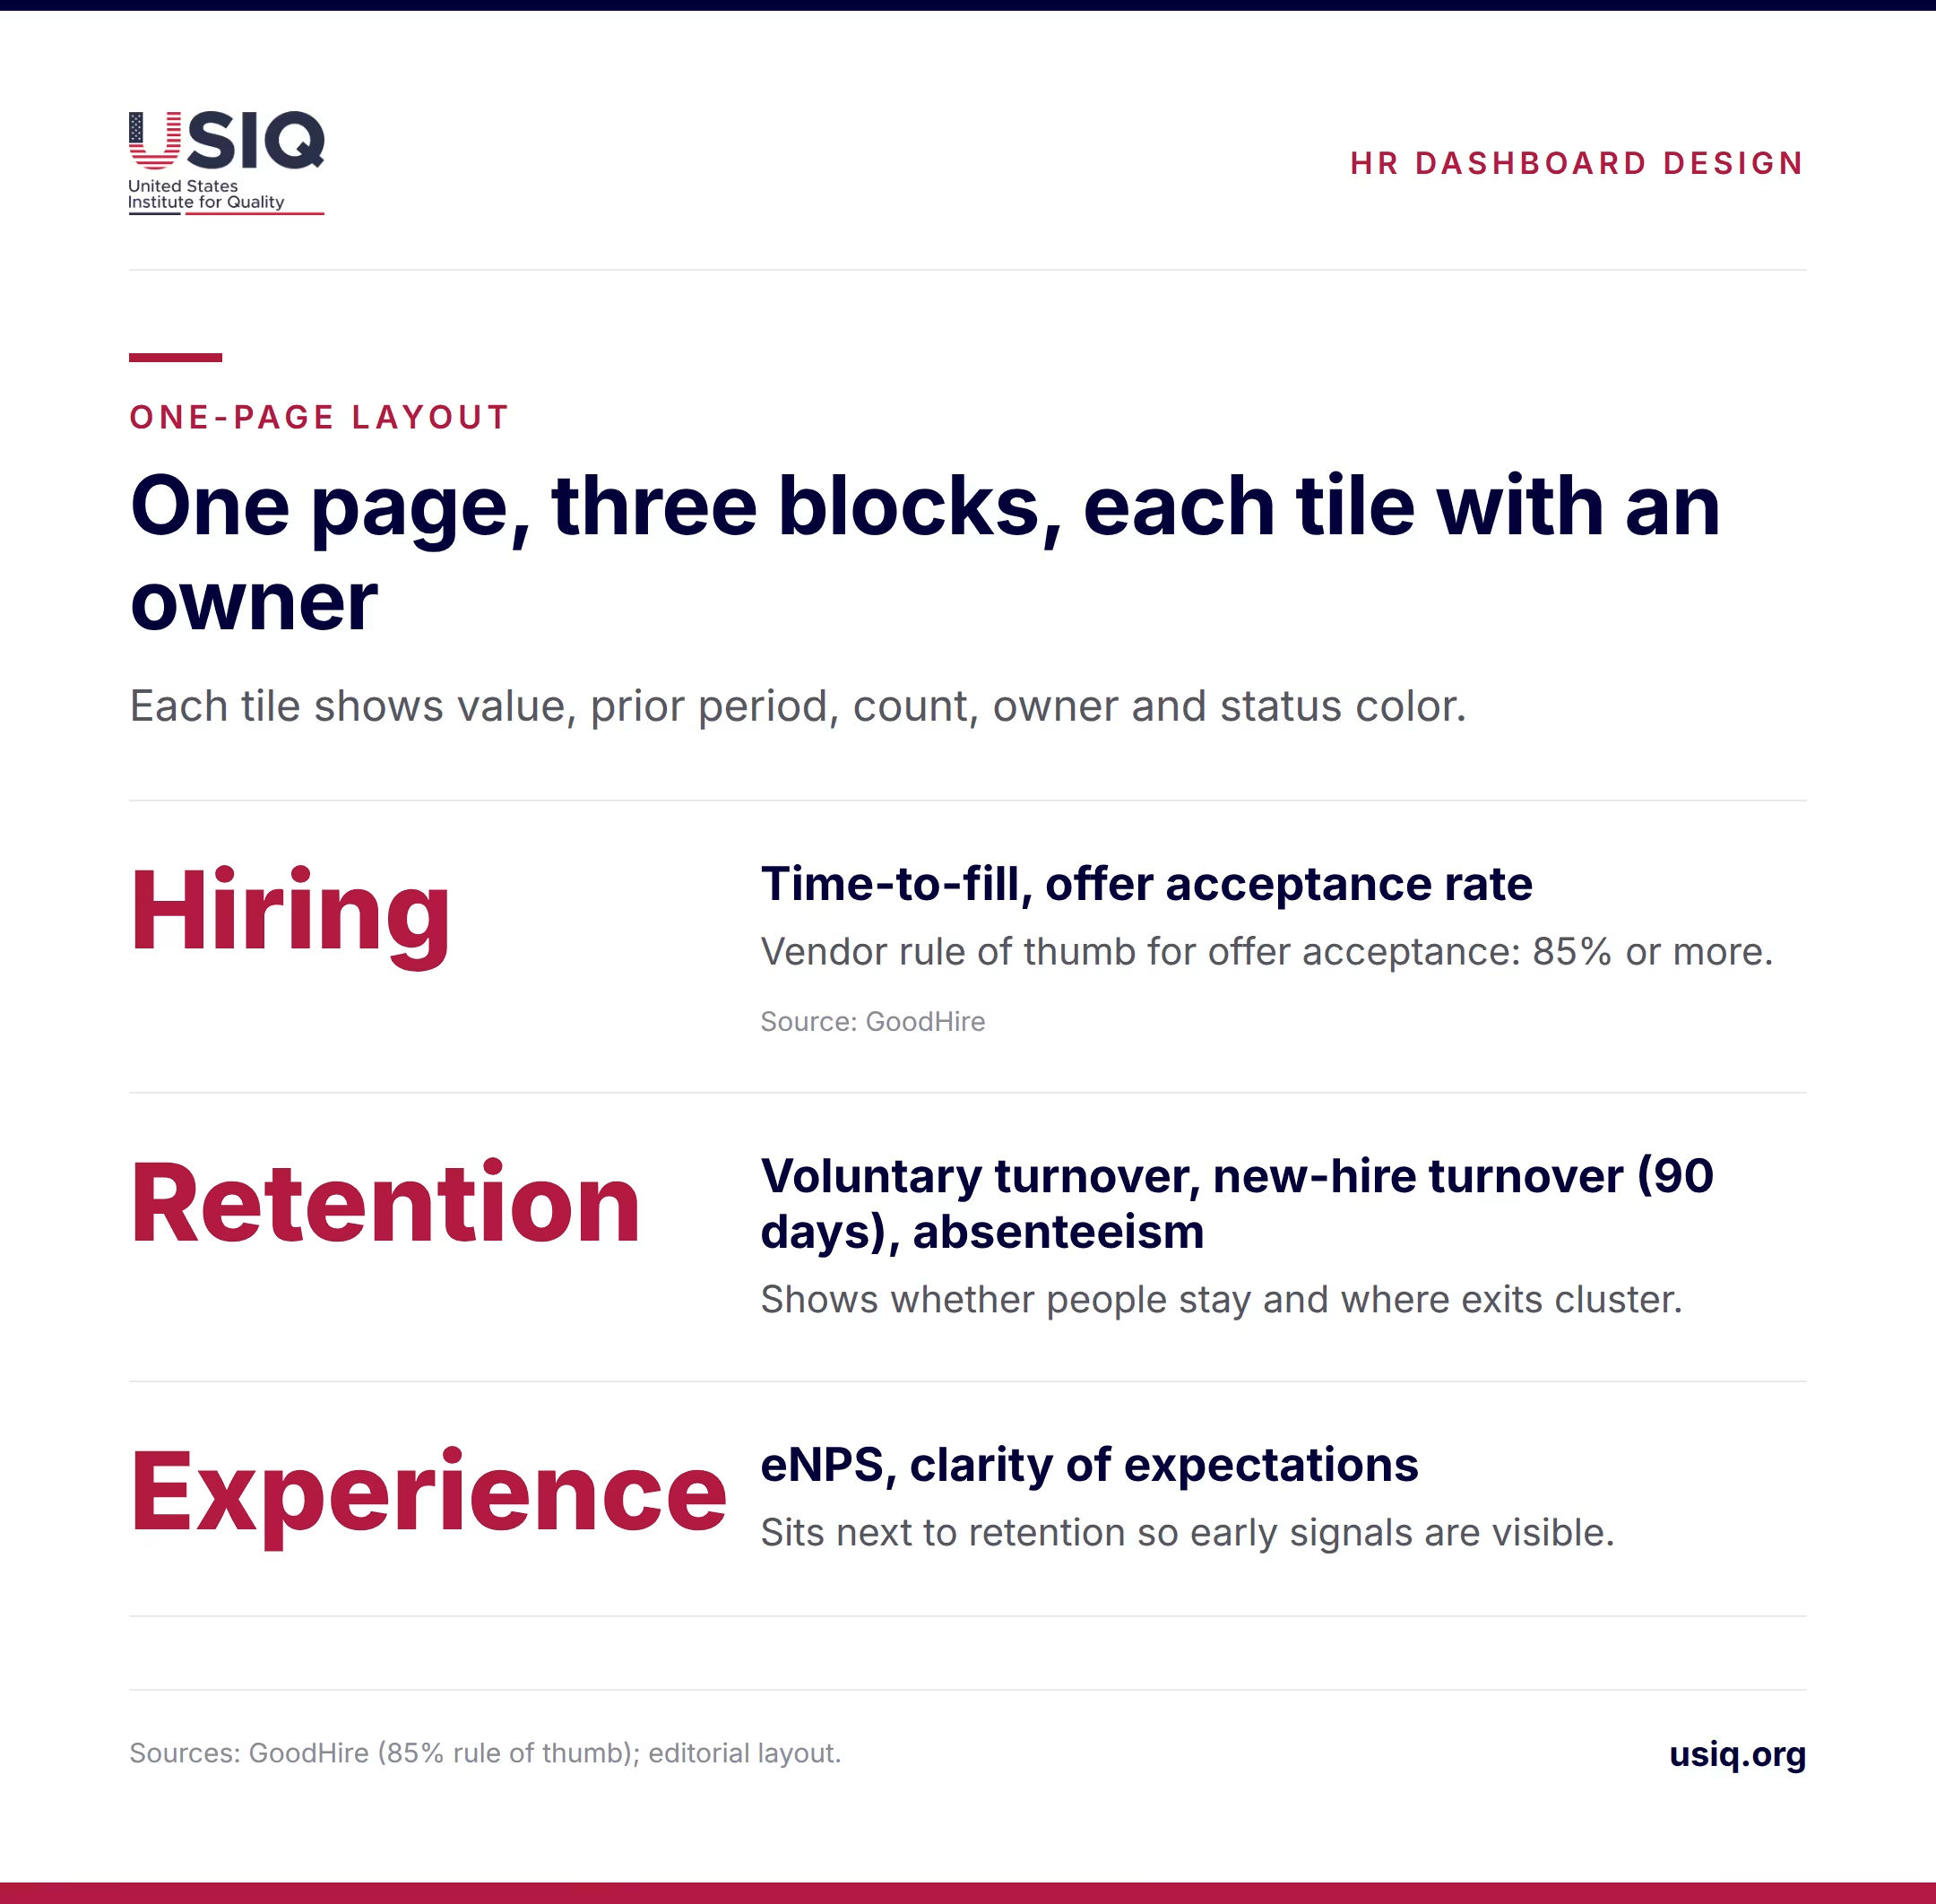
The layout fits on one screen or one printed page. Three blocks sit side by side or stacked: hiring on the left, retention in the middle, experience on the right. Each block holds three or four tiles. Each tile shows the current value, the same figure for the prior period, the count behind it and a status color tied to the threshold.
This mirrors what vendors already do in parts. BambooHR’s turnover dashboard pairs turnover and attrition with cost per employee, and Klipfolio’s engagement dashboard puts survey results, retention, sentiment and participation together. The addition here is the link between them: the experience block sits next to the retention block, so a drop in clarity of expectations is visible next to a rise in 90-day exits.
Sample dashboard rows with owners and triggers
The table shows how each row should read. Thresholds are illustrative starting points, not standards. Set your own from a 12-month baseline and revisit them once a year.
| Metric | Source | Owner | Example trigger | Action when triggered |
|---|---|---|---|---|
| Voluntary turnover | HRIS or payroll exits | HR lead | Rolling 12-month rate rises two quarters in a row | Run stay interviews in the affected team; review pay and workload |
| New-hire turnover (90 days) | HRIS hire and exit dates | Head of operations | Cohort rate above your own baseline, or two exits within 90 days under one manager | Audit job ads, onboarding plan and first-30-day check-ins |
| Time-to-fill | Applicant tracking | Recruiting owner | Median above your own 6-month baseline by a set margin | Review sourcing channels and interview steps |
| Offer acceptance rate | Applicant tracking | Hiring manager | Below 85% (a vendor rule of thumb) | Ask declined candidates why; check pay and start dates |
| eNPS | Quarterly pulse survey | HR lead | Falls for two quarters in a team with enough responses | Share results with the team and agree one change |
| Clarity of expectations | Quarterly pulse survey | Line managers | Team score below company score | Manager sets written priorities and reviews them in one-on-ones |
| Absenteeism rate | Time-off system | HR lead | Rolling 3-month rate climbs in one unit | Check workload, scheduling and burnout signals |
GoodHire calls an offer acceptance rate of 85% or more “generally healthy” and sets a 10% target for first-year new-hire turnover. That 10% covers the whole first year, so it does not map onto the 90-day row above. Both are vendor guidance, not government benchmarks, and a restaurant group and a software firm will not share the same normal.
How do your numbers compare with U.S. benchmarks?
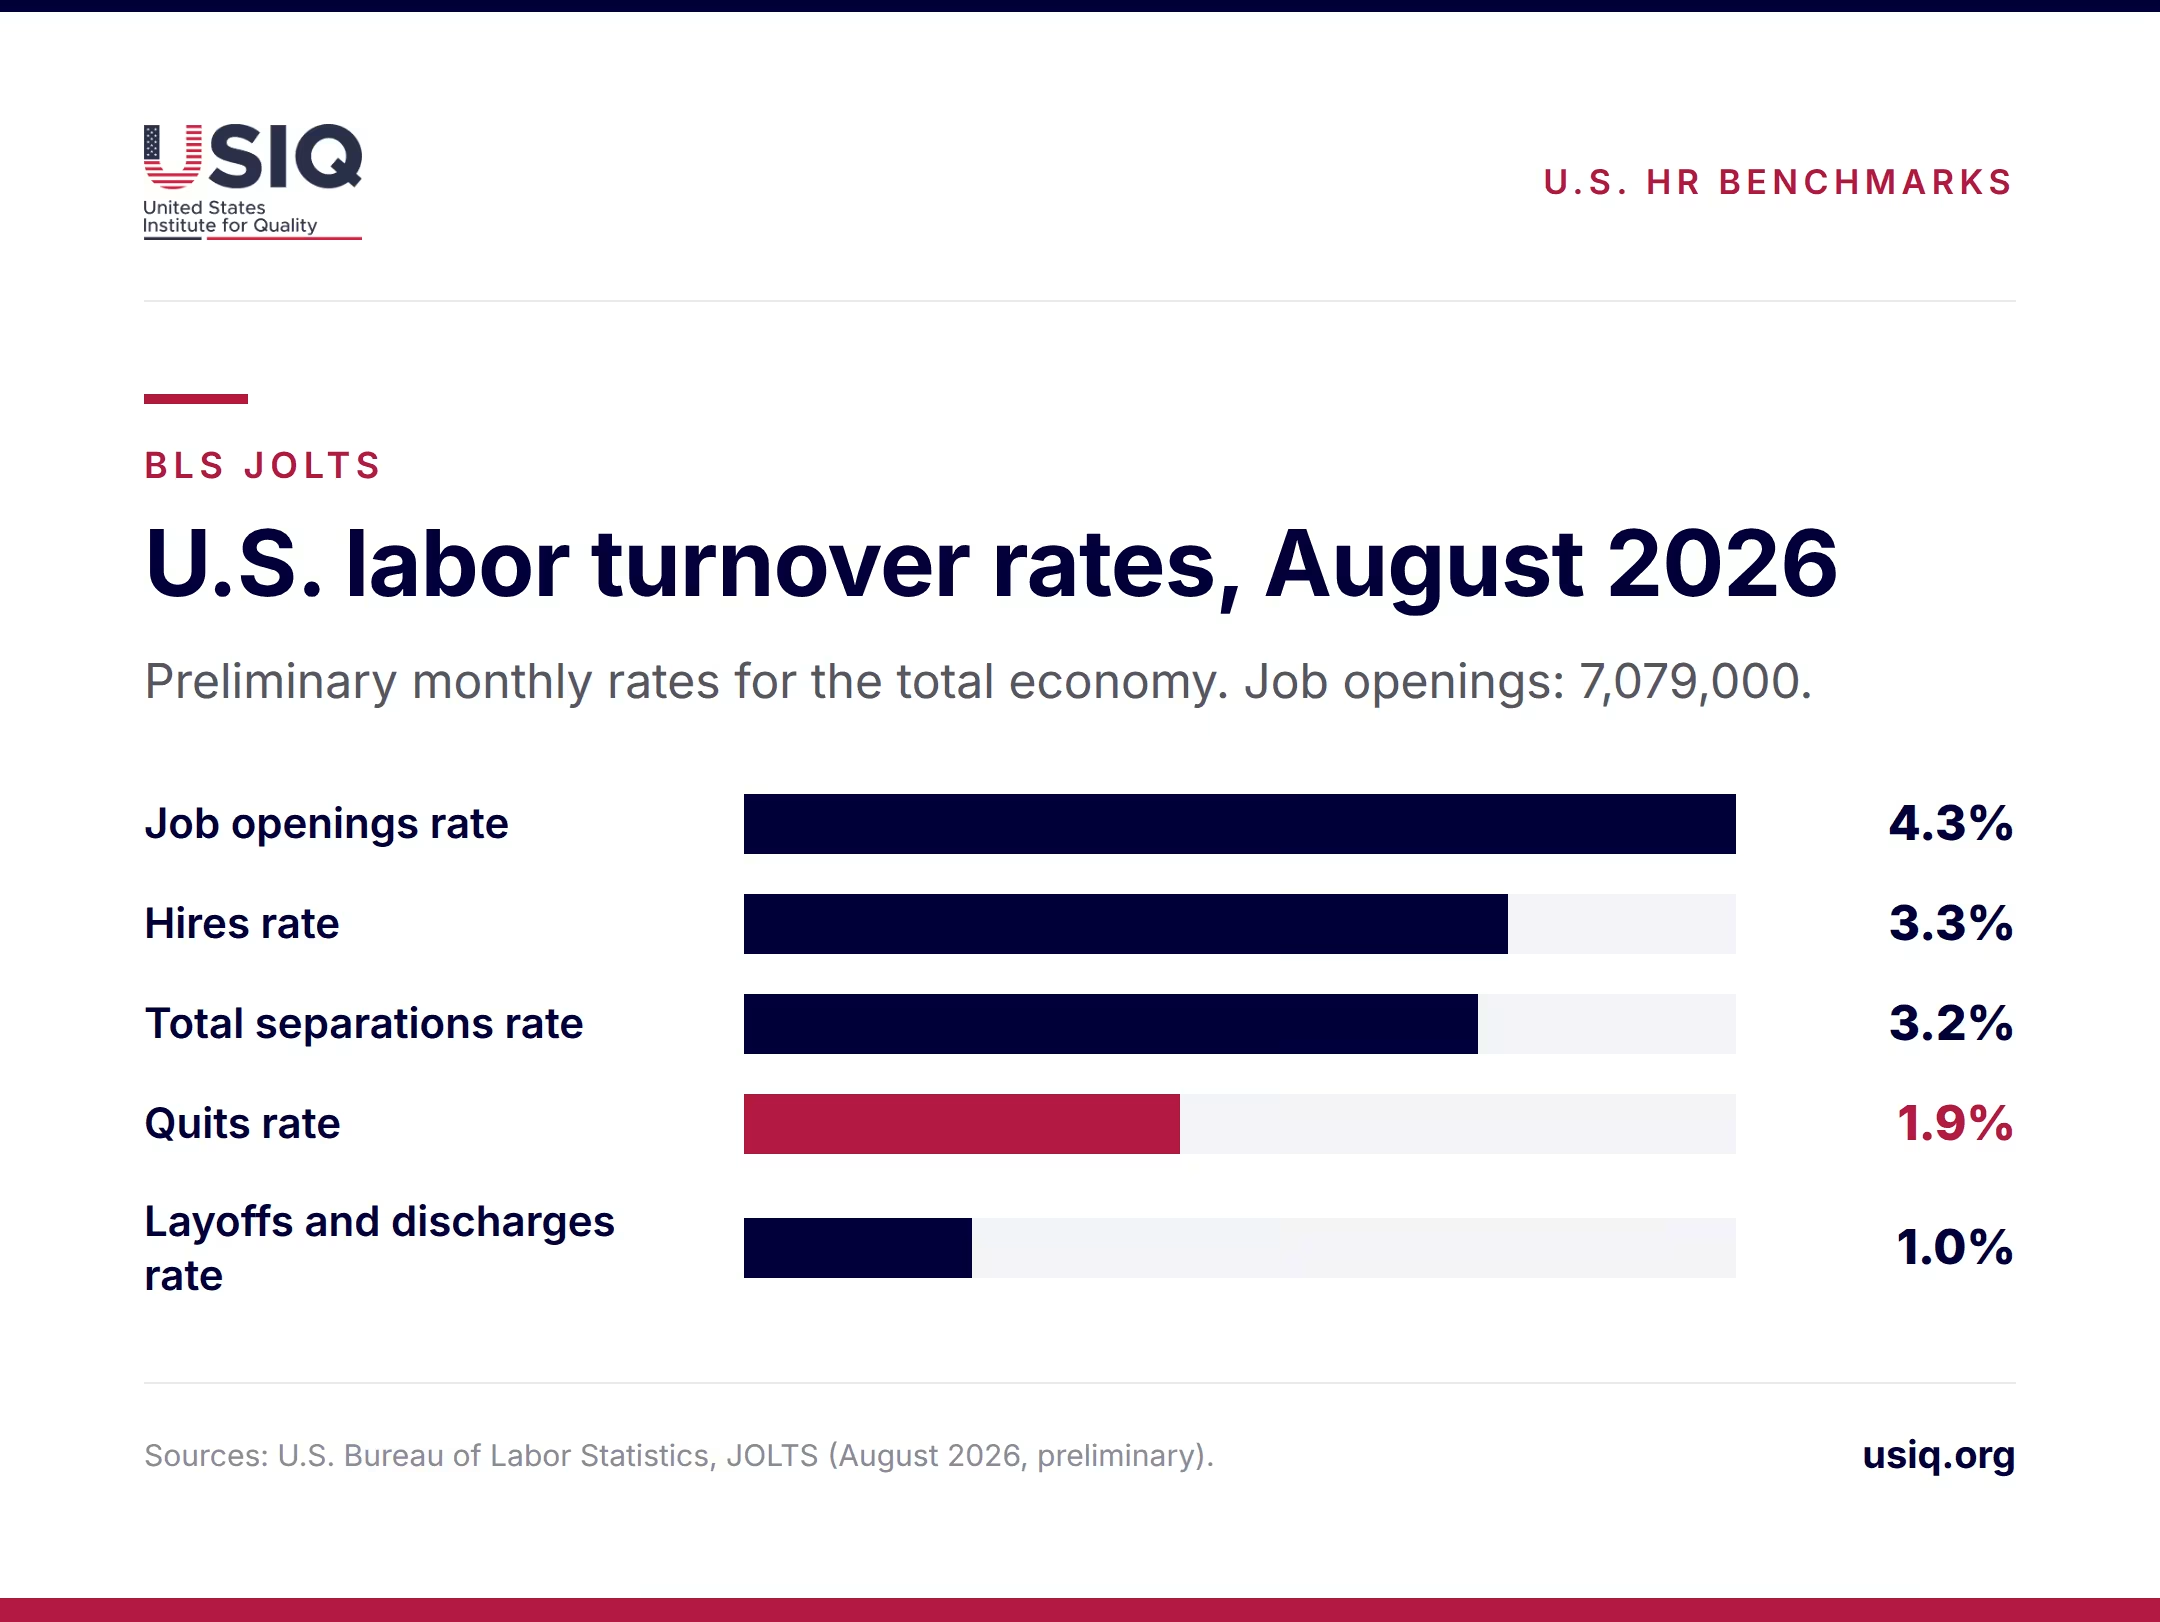
The Bureau of Labor Statistics publishes the Job Openings and Labor Turnover Survey (JOLTS), the standard public reference for hiring and separations. The preliminary figures for August 2026, on the BLS JOLTS page, are below. All are monthly rates for the total economy.
| JOLTS measure (Aug 2026, preliminary) | Value | Closest dashboard metric |
|---|---|---|
| Job openings | 7,079,000 (rate 4.3%) | Open roles, time-to-fill pressure |
| Hires rate | 3.3% | Hiring volume |
| Total separations rate | 3.2% | All exits |
| Quits rate | 1.9% | Voluntary turnover |
| Layoffs and discharges rate | 1.0% | Involuntary turnover |
To compare, convert your own rate to the same basis. JOLTS publishes monthly rates, so a quits rate of 1.9% a month would add up to roughly 23% over a year if it held steady, a simple multiplication and not a BLS figure. A company that reports 12-month voluntary turnover should compare it with a similarly annualized number, not with the monthly one.
Three cautions apply. First, the national rate blends very different industries. USIQ’s earlier analysis notes that turnover varies widely by sector, citing a late-2024 rate of 5.1% in leisure and hospitality against 1.3% for the comparison group it uses. Compare yourself with your own industry where the data allows. Second, JOLTS also publishes monthly estimates for all 50 states and the District of Columbia, but only at the total nonfarm level, so a state view describes the regional labor market, not your sector. Third, a 25-person firm cannot meaningfully match a monthly rate against a national one. Use the rolling 12-month count instead.
A voluntary turnover rate near the national quits pace is not a verdict. A rate that doubles within your own team in two quarters is.
How do you turn dashboard data into decisions?
A dashboard changes behavior only when the review is a standing meeting with a standing agenda. A workable rhythm has three layers. Managers glance at their team’s experience and absence figures monthly. HR and operations review the full page monthly and write down each trigger that fired. Leadership sees a short quarterly summary with trends, counts and the actions taken.
One owner, one trigger, one action
Every metric gets one named owner, because shared ownership usually means none. The owner is not necessarily the person who pulls the number; it is the person who answers when it moves. Each metric also gets a trigger written in advance, such as “two consecutive quarters of decline” or “above the company figure by a set margin”, and a first action. The review then becomes a short check: did a trigger fire, who is acting and by when?
Why manager data deserves a place
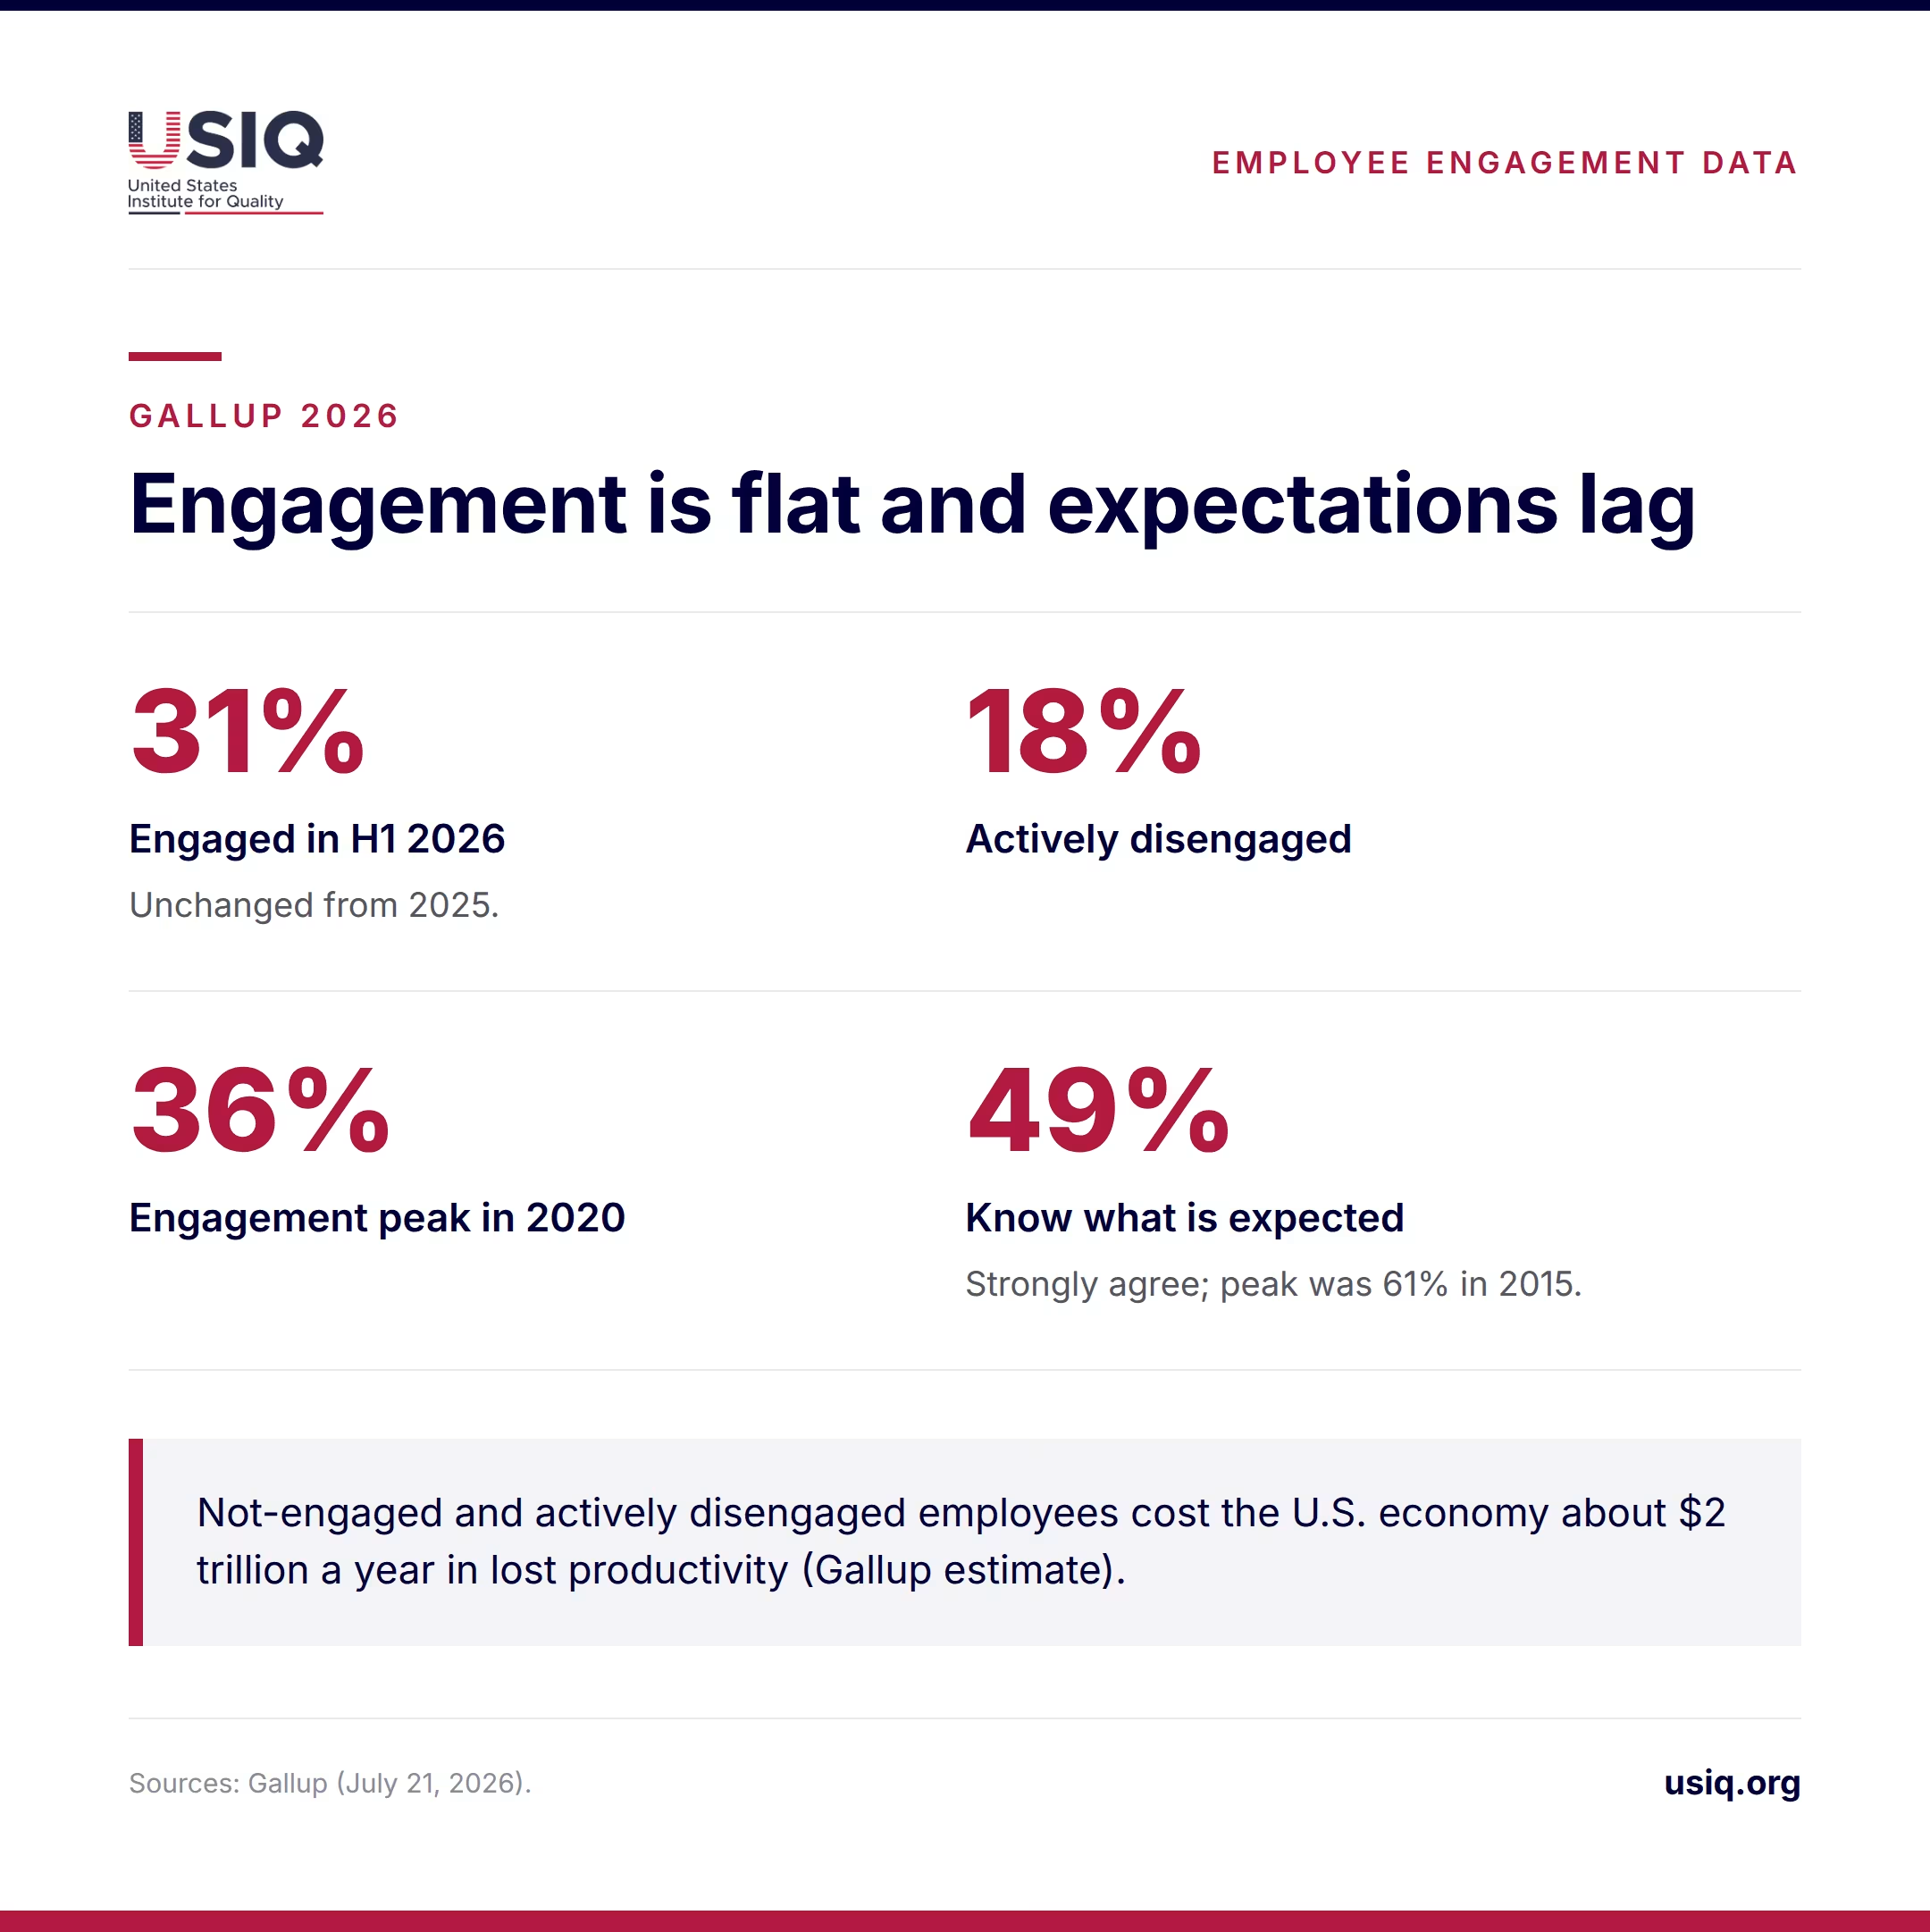
Gallup’s mid-2026 engagement release found 31% of U.S. employees engaged in the first half of 2026, unchanged from 2025, with 18% actively disengaged. Engagement peaked at 36% in 2020. Gallup estimates that each percentage point is about 1.6 million U.S. employees, and that not-engaged and actively disengaged employees cost the U.S. economy about $2 trillion a year in lost productivity. The same release links the best results from AI adoption to clear expectations, a thoughtful rollout and manager support, and it reports engagement six points higher where the organization has adopted AI than where it has not.
For a dashboard, the lesson is practical. Clear expectations and manager support are the conditions Gallup ties to better outcomes, and two or three survey items can measure them. Cut the experience block by manager, where group sizes allow, and the data points to conversations, not to blame. For a deeper look at how experience and engagement differ, see USIQ’s piece on employee experience versus engagement.
What are the legal and privacy limits on people data?
A people dashboard pulls together information that is sensitive by nature: who left, who was absent, how teams answered survey questions. The legal rules that apply depend on the state, the city and the tools involved, so this section sets out design principles and questions for counsel, not a legal checklist.
- Small-group suppression. Set a minimum group size for any survey result or cut. If a team has only a handful of respondents, show the company-level figure instead so no one can be identified.
- Access control. Managers see their own team, HR sees the company and leadership sees summaries. Individual-level absence or health-related detail does not belong on a shared dashboard.
- Retention. Ask counsel which employment and survey records you must keep, for how long, and which you should delete. Do not rely on a software vendor’s default.
- Protected-class cuts. Reports by gender, race, age or similar categories, such as pay-gap or DEI views, should sit in a restricted workspace and be reviewed by counsel before use in decisions.
- Automated tools. If any part of the dashboard or the hiring funnel uses automated scoring or screening, check federal, state and local rules before relying on it. Some jurisdictions regulate these tools specifically.
Document who can see what and why. A short data-use note, shared with employees along with the survey, also helps response rates, because people answer more candidly when they know how results are used.
What are the common mistakes and counterarguments?
Vanity metrics and dashboards nobody uses
Headcount growth, number of training hours or total survey responses can look good while saying nothing about retention or experience. A simple test applies: if a metric turns red, can you name the action and the person who takes it? If not, drop it. A dashboard that is reviewed for six months without a single logged action is a reporting habit, not a management tool.
Survey fatigue and thin samples
Frequent surveys tire employees, especially when nothing visibly changes afterward. Keep the pulse survey to five or six items, run it quarterly, and report back what changed. Watch the participation metric: if it falls, the experience scores above it are less reliable. In small teams, percentages built on a few responses can mislead, so show counts and avoid reading trends from one quarter.
Misconceptions worth correcting
- “Lower turnover is always better.” Losing weak performers or people in poor-fit roles can be healthy. Look at who leaves, not only how many.
- “A benchmark is a target.” JOLTS and vendor rules of thumb describe a broad market, not what is right for your sector or size.
- “Software makes the dashboard.” Definitions, owners and a review habit do. A spreadsheet with ten well-defined rows beats an unconfigured platform with fifty tiles.
What are the practical steps to build the dashboard?
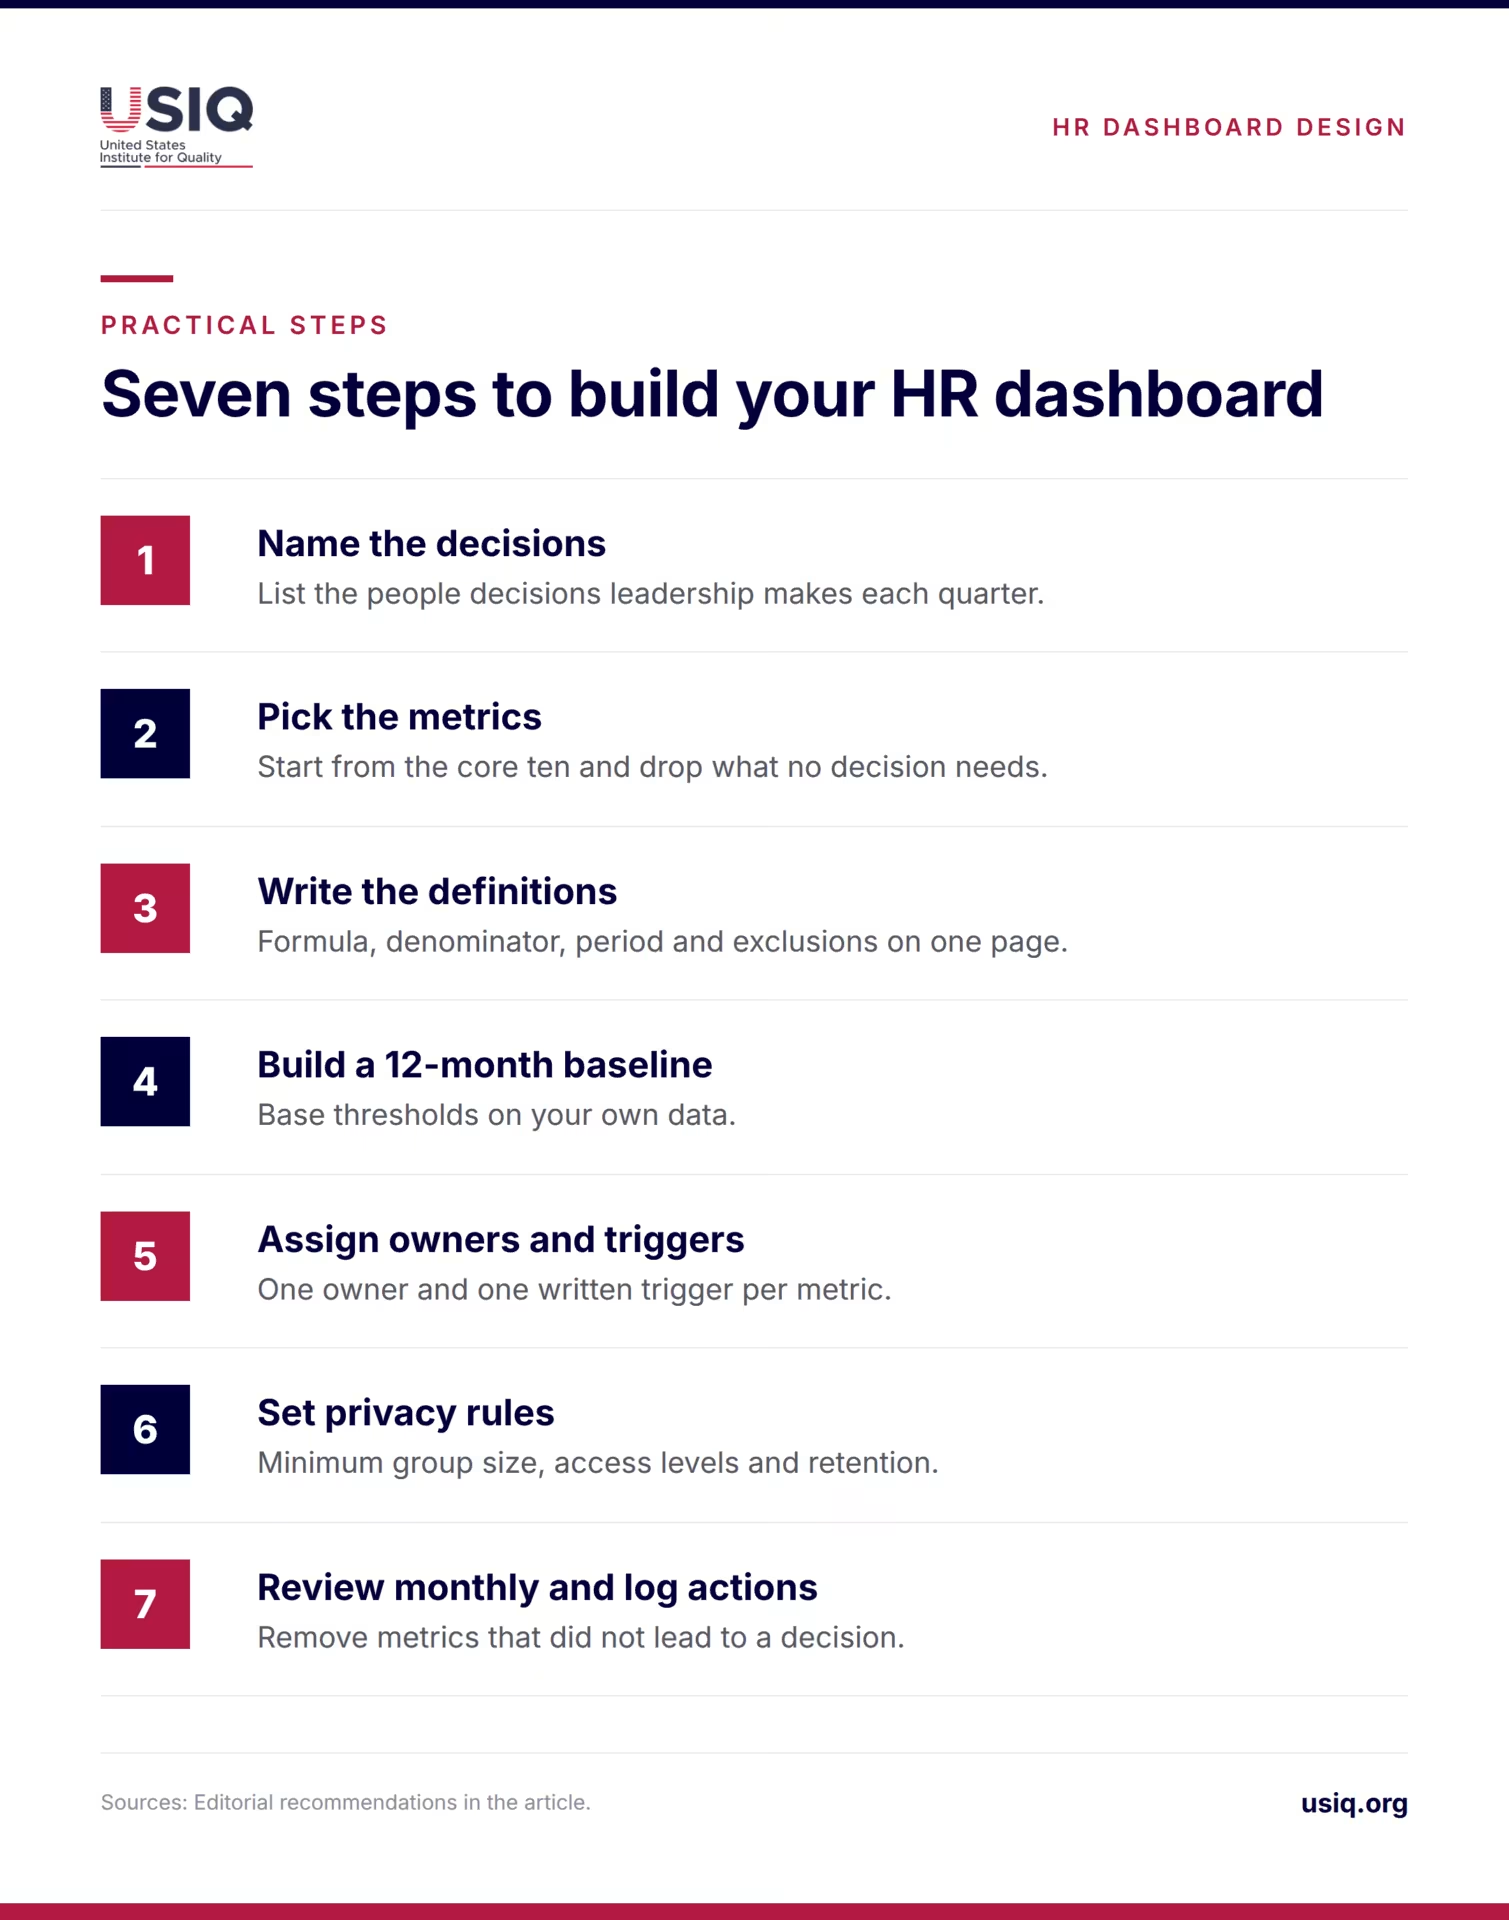
- Name the decisions. List the five or six people decisions leadership makes each quarter, such as hiring plans, manager coaching and pay reviews.
- Pick the metrics. Start from the core ten and drop any that no decision requires.
- Write the definitions. Formula, denominator, period and exclusions on one page. Separate voluntary and involuntary exits.
- Build a baseline. Pull 12 months of history so thresholds rest on your own data.
- Assign owners and triggers. One owner and one written trigger per metric.
- Set privacy rules. Minimum group size, access levels and retention, reviewed by counsel.
- Review monthly and log actions. Revisit the metric list after two quarters and remove what did not lead to a decision.
Expect more attention to expectations, manager support and the way new tools such as AI are introduced, since Gallup ties better outcomes to those factors. For wider context on where workforce priorities are heading, see USIQ’s overview of HR trends for 2026.
Conclusion
The best dashboards are short, defined and tied to action. Ten metrics in three blocks, each with a formula, an owner and a trigger, will do more for retention and hiring than a wall of charts. Start small, protect the data and remove anything that never leads to a decision.
FAQ
How many metrics should an HR dashboard have?
Eight to ten is enough for most small and mid-sized employers. Group them into hiring, retention and experience so each block answers one question. If a metric has no owner, no threshold and no action attached, remove it. You can add metrics later when a specific decision calls for them.
Can a small company use an HR dashboard?
Yes, with adjustments. In a 25-person firm, one exit equals 4% of headcount for the month, so monthly percentages jump around. Track counts and a rolling 12-month view, add a short quarterly pulse survey and review the page monthly. A spreadsheet is enough to start.
What is the difference between turnover and attrition?
Definitions vary, and dashboards often mix the terms. Decide what each means in your company and write it down. Whatever you choose, report voluntary and involuntary exits separately, because resignations signal experience problems while dismissals point to hiring or performance management. Keep the same denominator every period.
Where can I find a U.S. benchmark for turnover?
The Bureau of Labor Statistics publishes JOLTS, including monthly rates for hires, total separations, quits and layoffs, plus state estimates at the total nonfarm level. For August 2026, the preliminary quits rate was 1.9%. Convert your figures to the same period before comparing, and keep industry differences in mind.
Are the 10% and 85% thresholds official standards?
No. GoodHire describes an offer acceptance rate of 85% or more as generally healthy and sets a 10% target for first-year new-hire turnover. Both are vendor guidance, not government benchmarks, and the 10% does not apply to a 90-day measure. Use them as a rough check, then set thresholds from at least 12 months of your own data.
How often should we survey employees?
A short quarterly pulse works for most firms: five or six items covering eNPS, clarity of expectations and manager support. More frequent surveys risk fatigue, especially if nothing changes afterward. Track participation, share what you changed and suppress results for groups too small to protect anonymity.
Do we need legal review before building a people dashboard?
It is wise. Rules on record retention, protected-class reporting and automated hiring tools differ by state and city, and a dashboard can pull sensitive data together in one place. Ask counsel to review access levels, minimum group sizes, retention periods and any tool that scores or screens candidates.
Why track clarity of expectations?
It is a simple, actionable survey item. Gallup reports that 49% of U.S. employees strongly agreed they know what is expected of them in H1 2026, below the 61% peak in 2015. Because managers can improve it directly, it helps turn survey data into concrete conversations.
Sources
- Gallup, “Employee Engagement Remains Flat as AI Adoption Accelerates,” July 21, 2026. https://www.gallup.com/workplace/712433/employee-engagement-remains-flat-adoption-accelerates.aspx
- U.S. Bureau of Labor Statistics, “Job Openings and Labor Turnover Survey (JOLTS) Home,” latest data August 2026 (preliminary). https://www.bls.gov/jlt/
- GoodHire, “Essential HR Metrics for SMBs: Recruiting, Retention & Engagement.” https://www.goodhire.com/resources/articles/hr-metrics/
- BambooHR, “7 Powerful HR Dashboard Examples.” https://www.bamboohr.com/blog/hr-dashboard-examples
- Klipfolio, “HR Dashboard: Examples, Templates, and Best Practices.” https://www.klipfolio.com/resources/dashboard-examples/hr
- USIQ, “HR Analytics: Metrics That Improve Employee Experience.” https://www.usiq.org/blog/hr-analytics-how-data-can-transform-employee-experience/


Related Articles
Employee experience and customer experience are linked, but the link is weaker and more conditional than popular slogans suggest. This article reviews the evidence on staffing, training and workplace conditions and shows how employers can test the connection in their own business.
Most HR dashboards show too many metrics and trigger too few decisions. This guide defines ten employee experience metrics, shows a one-page layout and explains how to read your numbers against U.S. data.

Engagement at the workplace means how connected people feel to their jobs and the company they work for. It is [...]
In today's labor market of the US, the term best organization to work for has come to mean those employers [...]