

“Happy employees make happy customers” is one of the most repeated lines in business writing. Owners of restaurants, stores and service firms hear it constantly, usually from vendors selling a survey platform. The harder question is whether the link between employee experience and customer experience is strong enough to justify spending, and whether the way a company treats its people measurably changes what customers get.
The evidence is real, but narrower than the slogans. Large datasets show a positive association. One peer-reviewed study gets closer to cause and effect. National customer satisfaction data, meanwhile, shows that better retention and profits do not automatically mean happier customers.
This article looks at three levers an employer controls: staffing and turnover, training and coaching, and workplace conditions. It then covers the counterarguments and a practical way for a small or mid-sized business to test the link locally.
Quick answer: Employee experience and customer experience are connected. Gallup found that business units with top-quartile engagement had a median 10% higher customer loyalty and engagement than bottom-quartile units. The evidence is largely correlational, though, and service disruptions weaken the effect. Employers should test the link at one location before investing broadly.
Key takeaways
- Gallup’s analysis of 183,806 units found a median 10% customer loyalty and engagement gap between top- and bottom-quartile engagement units.
- A peer-reviewed car rental study found engagement raised customer satisfaction and retention, using an approach designed to approximate causality.
- Customer-facing sectors lose staff fastest: the August 2026 quits rate was 3.5% in accommodation and food services and 3.0% in retail, against 1.9% overall.
- A vendor survey reports that 63% of front line workers have not received feedback that improves their performance, which points to a coaching gap.
- Service disruptions weaken the engagement effect, so fixing operations matters as much as morale.
- The ACSI reports no detectable return on an estimated $100 billion-plus of CX investment, a reminder to measure results tied to revenue.
- Small employers can start by linking employee feedback and customer ratings at a single location.
Does employee experience really affect customer experience?
Employee experience is the sum of what people encounter at work: their schedules, tools, managers, training, recognition and conditions. Customer experience is the sum of what customers encounter when they deal with the company. The two meet at the front line, where employees deliver the service customers judge.
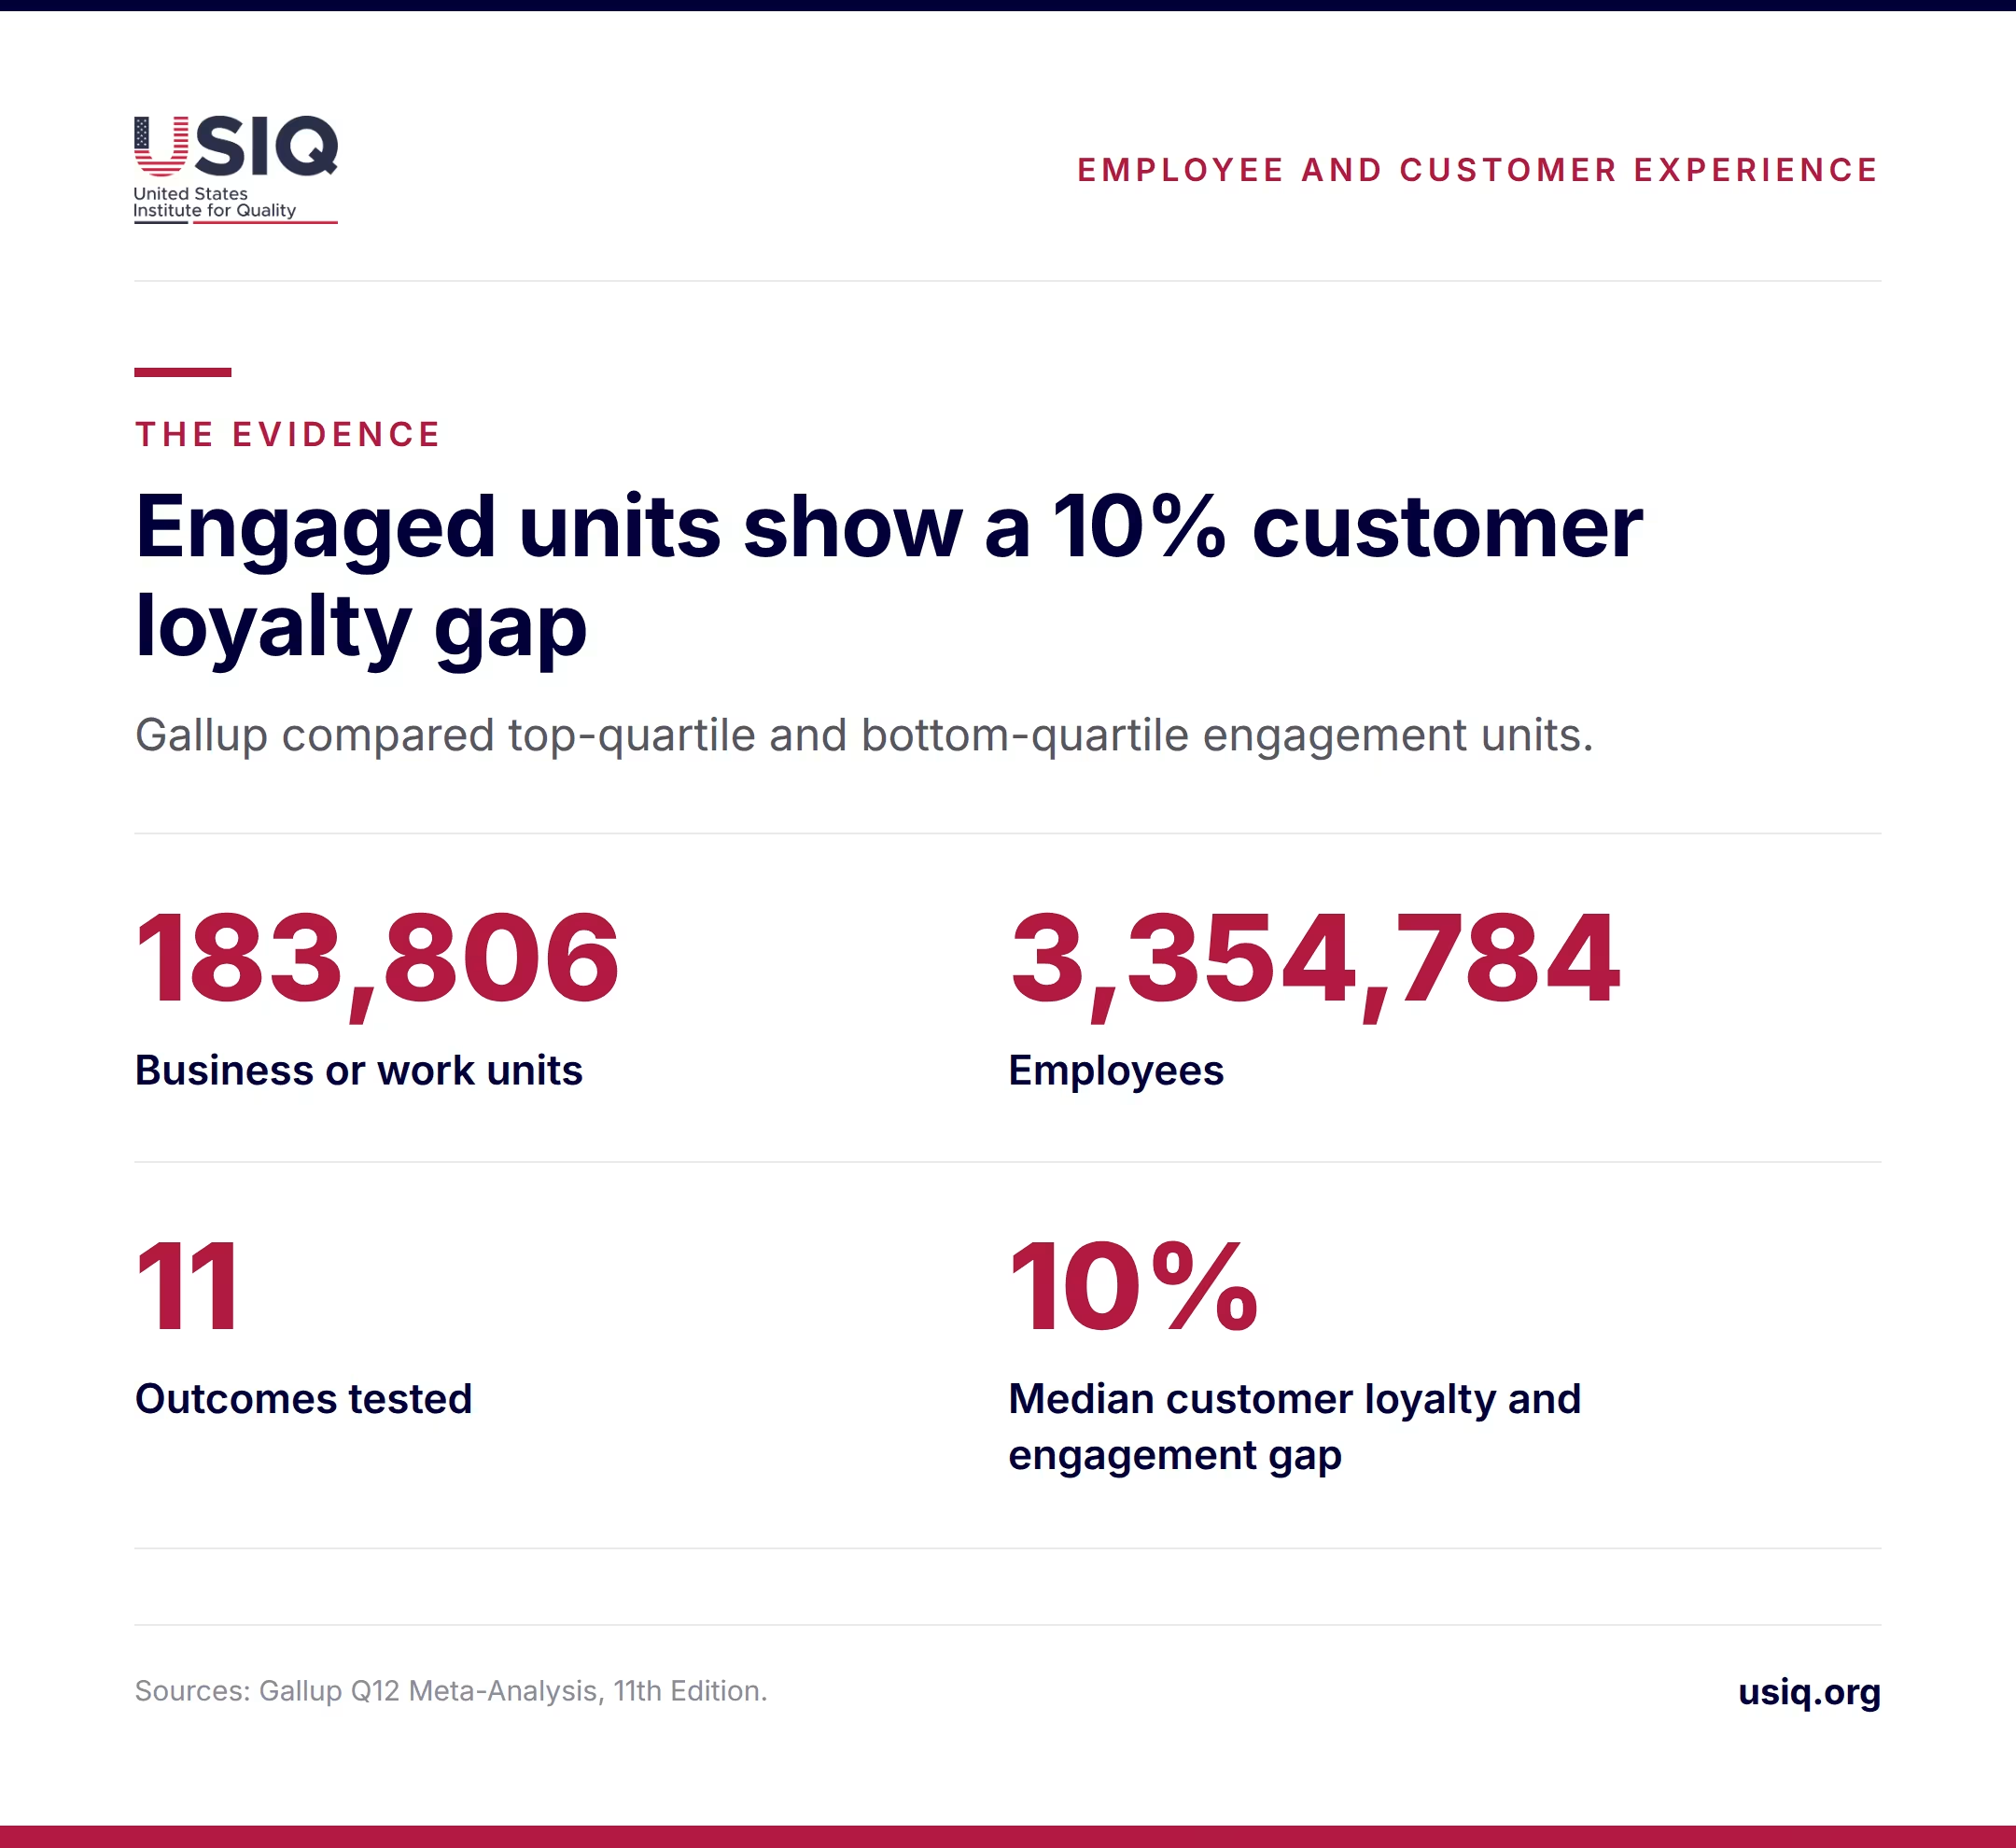
The broadest evidence comes from Gallup’s Q12 meta-analysis, which covered 183,806 business or work units and 3,354,784 employees and tested 11 outcomes. Comparing top-quartile and bottom-quartile engagement units, the median difference in customer loyalty and engagement was 10% (Gallup Q12 Meta-Analysis, 11th Edition).
A second source gets closer to causation. Researchers Khwaja and Yang studied data from a large car rental company and found that employee engagement had a positive effect on customer satisfaction and retention. They used retirement-induced turnover as an instrument to approximate causality (Quantitative Marketing and Economics, 2022).
The paper itself adds a caution: it describes support for the value chain framework, the system of relationships it examined, as “purely correlational.” The evidence points in one direction, but it does not promise that any given engagement program will raise customer scores.
How does staffing and turnover show up in the customer experience?
Customers rarely see an engagement score. They see who is behind the counter, how long the line is and whether the person helping them knows the job. High turnover erodes all three, because experienced staff leave and newcomers need time to learn.
Turnover is highest where customer contact is heaviest. The Bureau of Labor Statistics reported a total non farm quits rate of 1.9% in August 2026, down from 2.0% a year earlier. Customer-facing industries ran well above that (BLS, The Economics Daily).
| Industry (August 2026) | Quits rate | Year earlier |
|---|---|---|
| Accommodation and food services | 3.5% | 3.9% |
| Retail trade | 3.0% | 2.4% |
| Other services | 2.7% | 2.0% |
| Professional and business services | 2.1% | 2.5% |
| Health care and social assistance | 2.0% | 2.2% |
| Manufacturing | 1.6% | 1.3% |
| Total non farm | 1.9% | 2.0% |
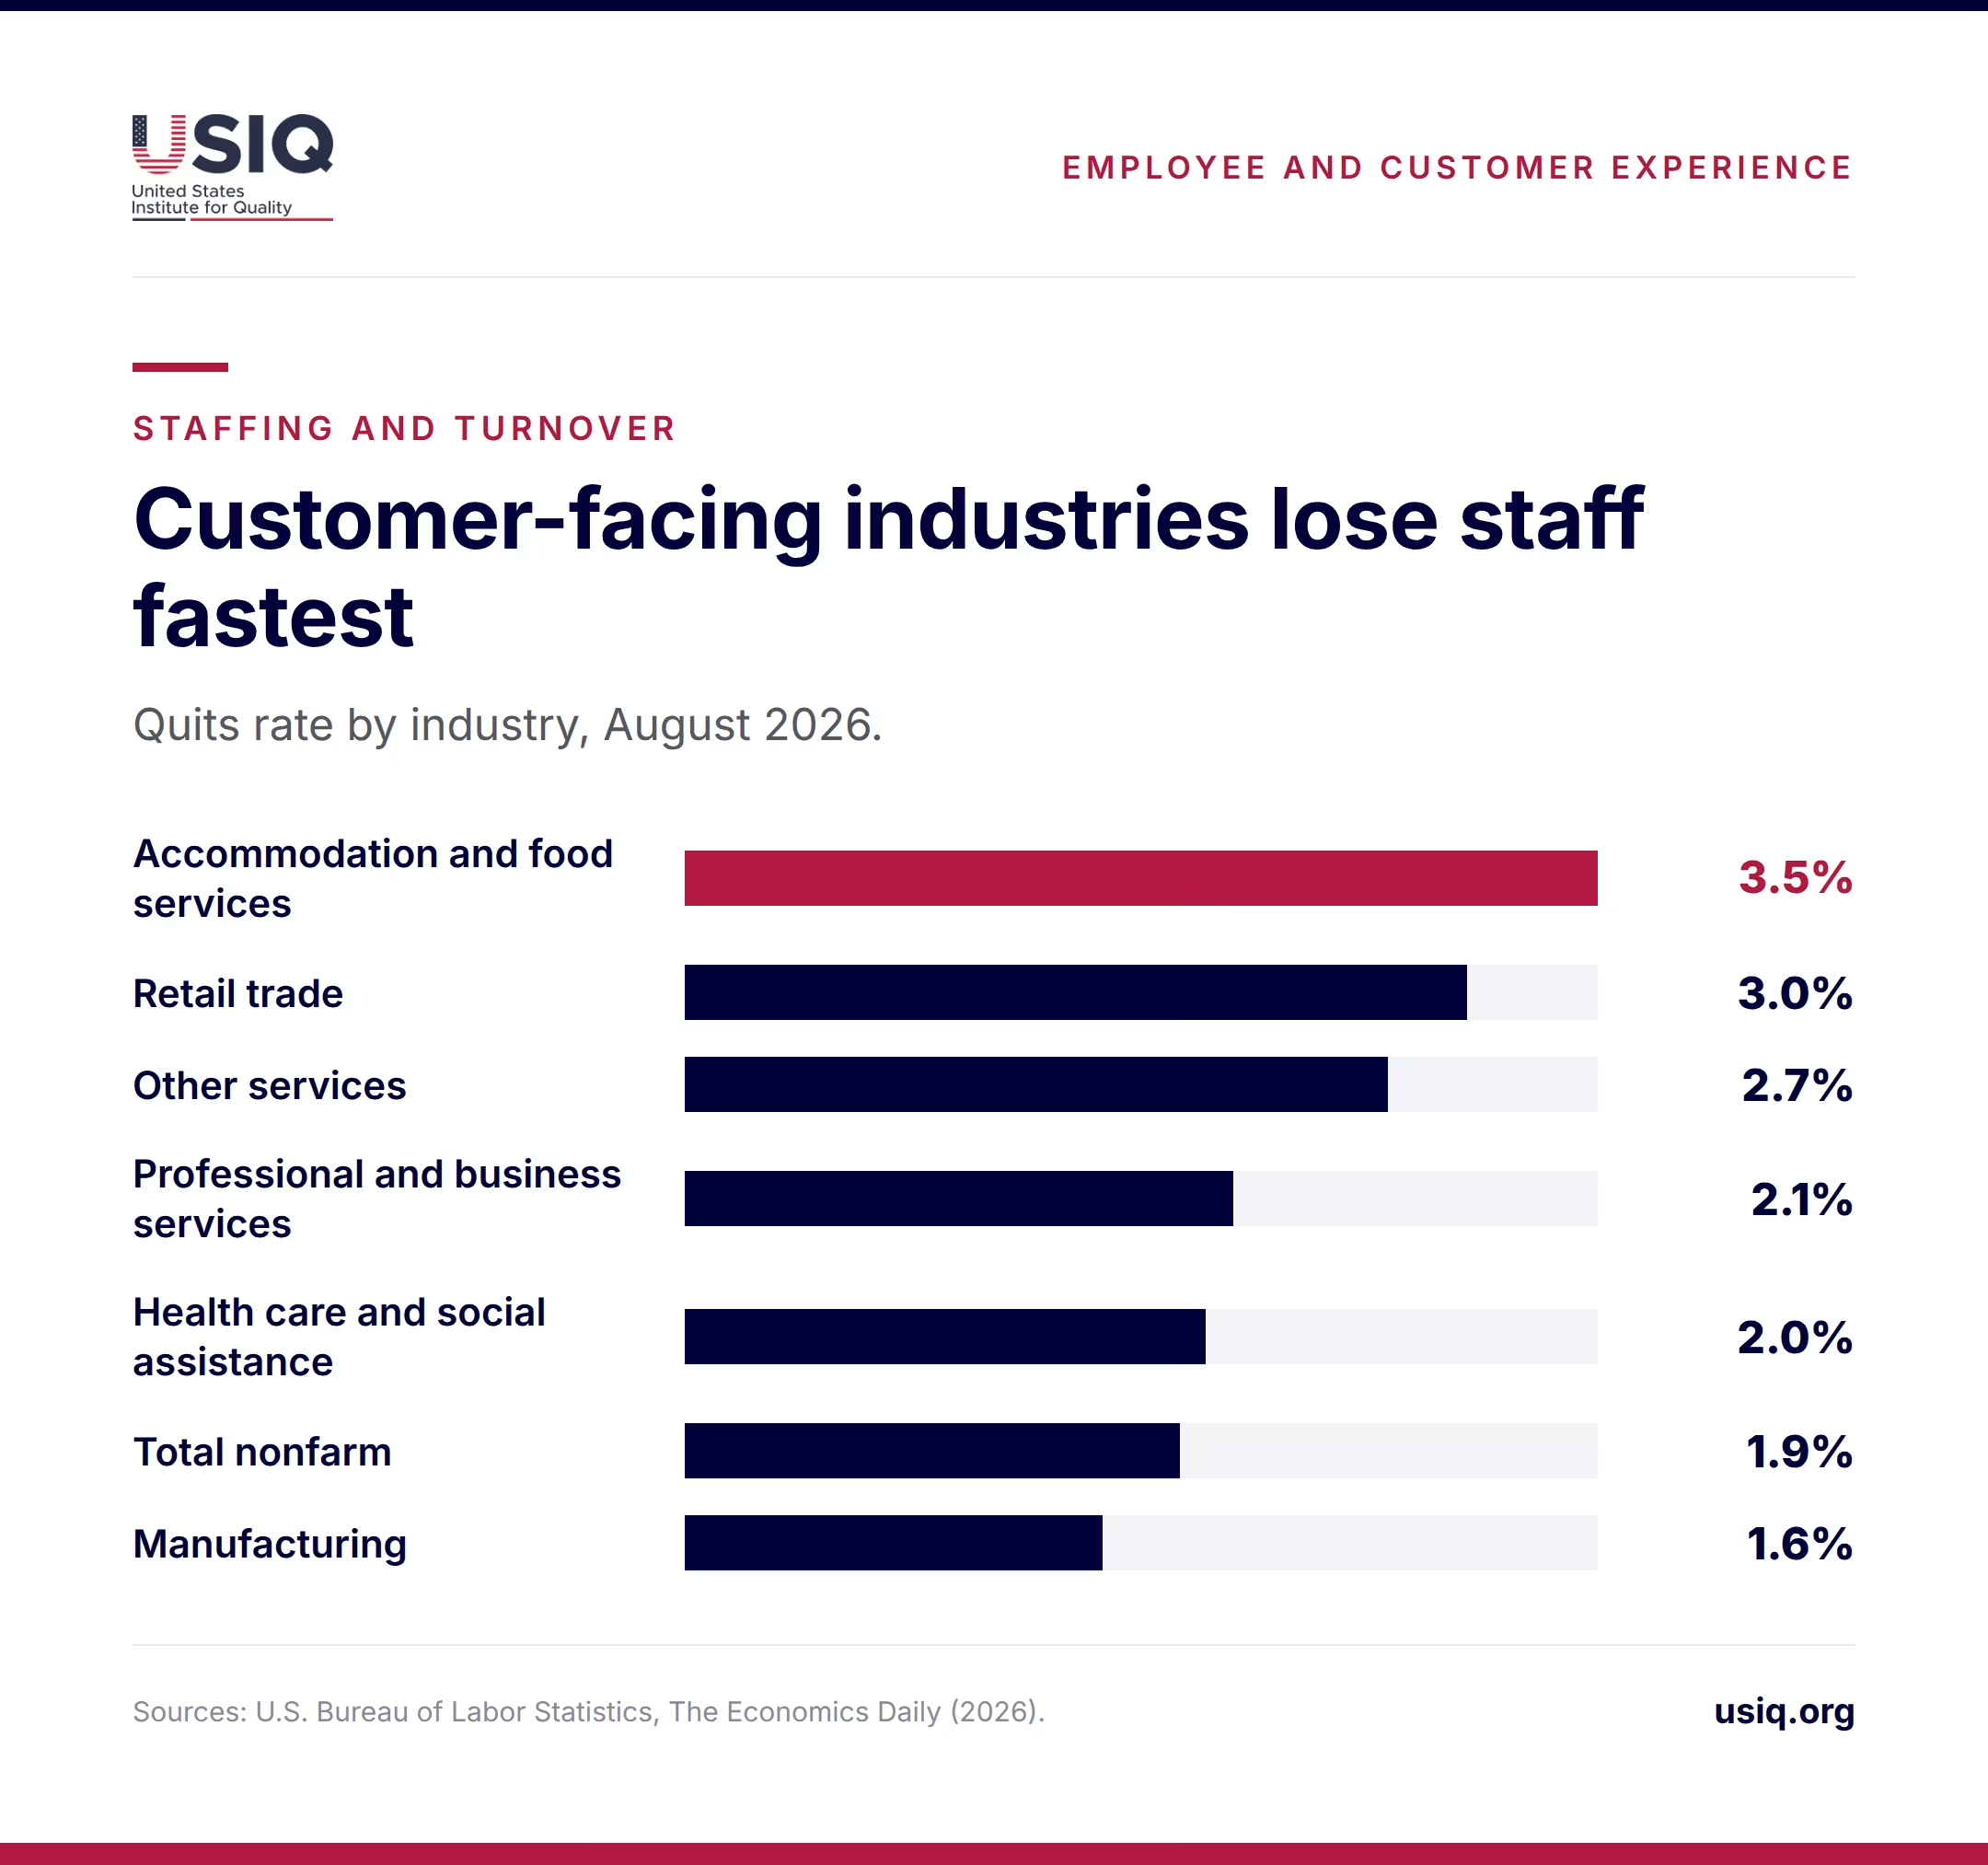
The direction of travel differs by sector. Retail, other services and manufacturing saw quits rise year over year, while accommodation and food services fell from 3.9% to 3.5%, and professional and business services and health care also eased. A retailer should not assume the sector’s churn is a stable background condition.
Gallup’s data adds a turnover angle. Top-quartile engagement units showed a 51% difference in turnover among low-turnover organizations and 21% among high-turnover organizations, defined as those above 40% annualized turnover (Gallup). The link to customers is continuity: the same familiar people serving the same regulars.
Under-staffing and customer ratings are best examined locally. Comparing a location’s hours of coverage per shift with its complaints is a simple start.
Why does training and manager coaching matter for service quality?
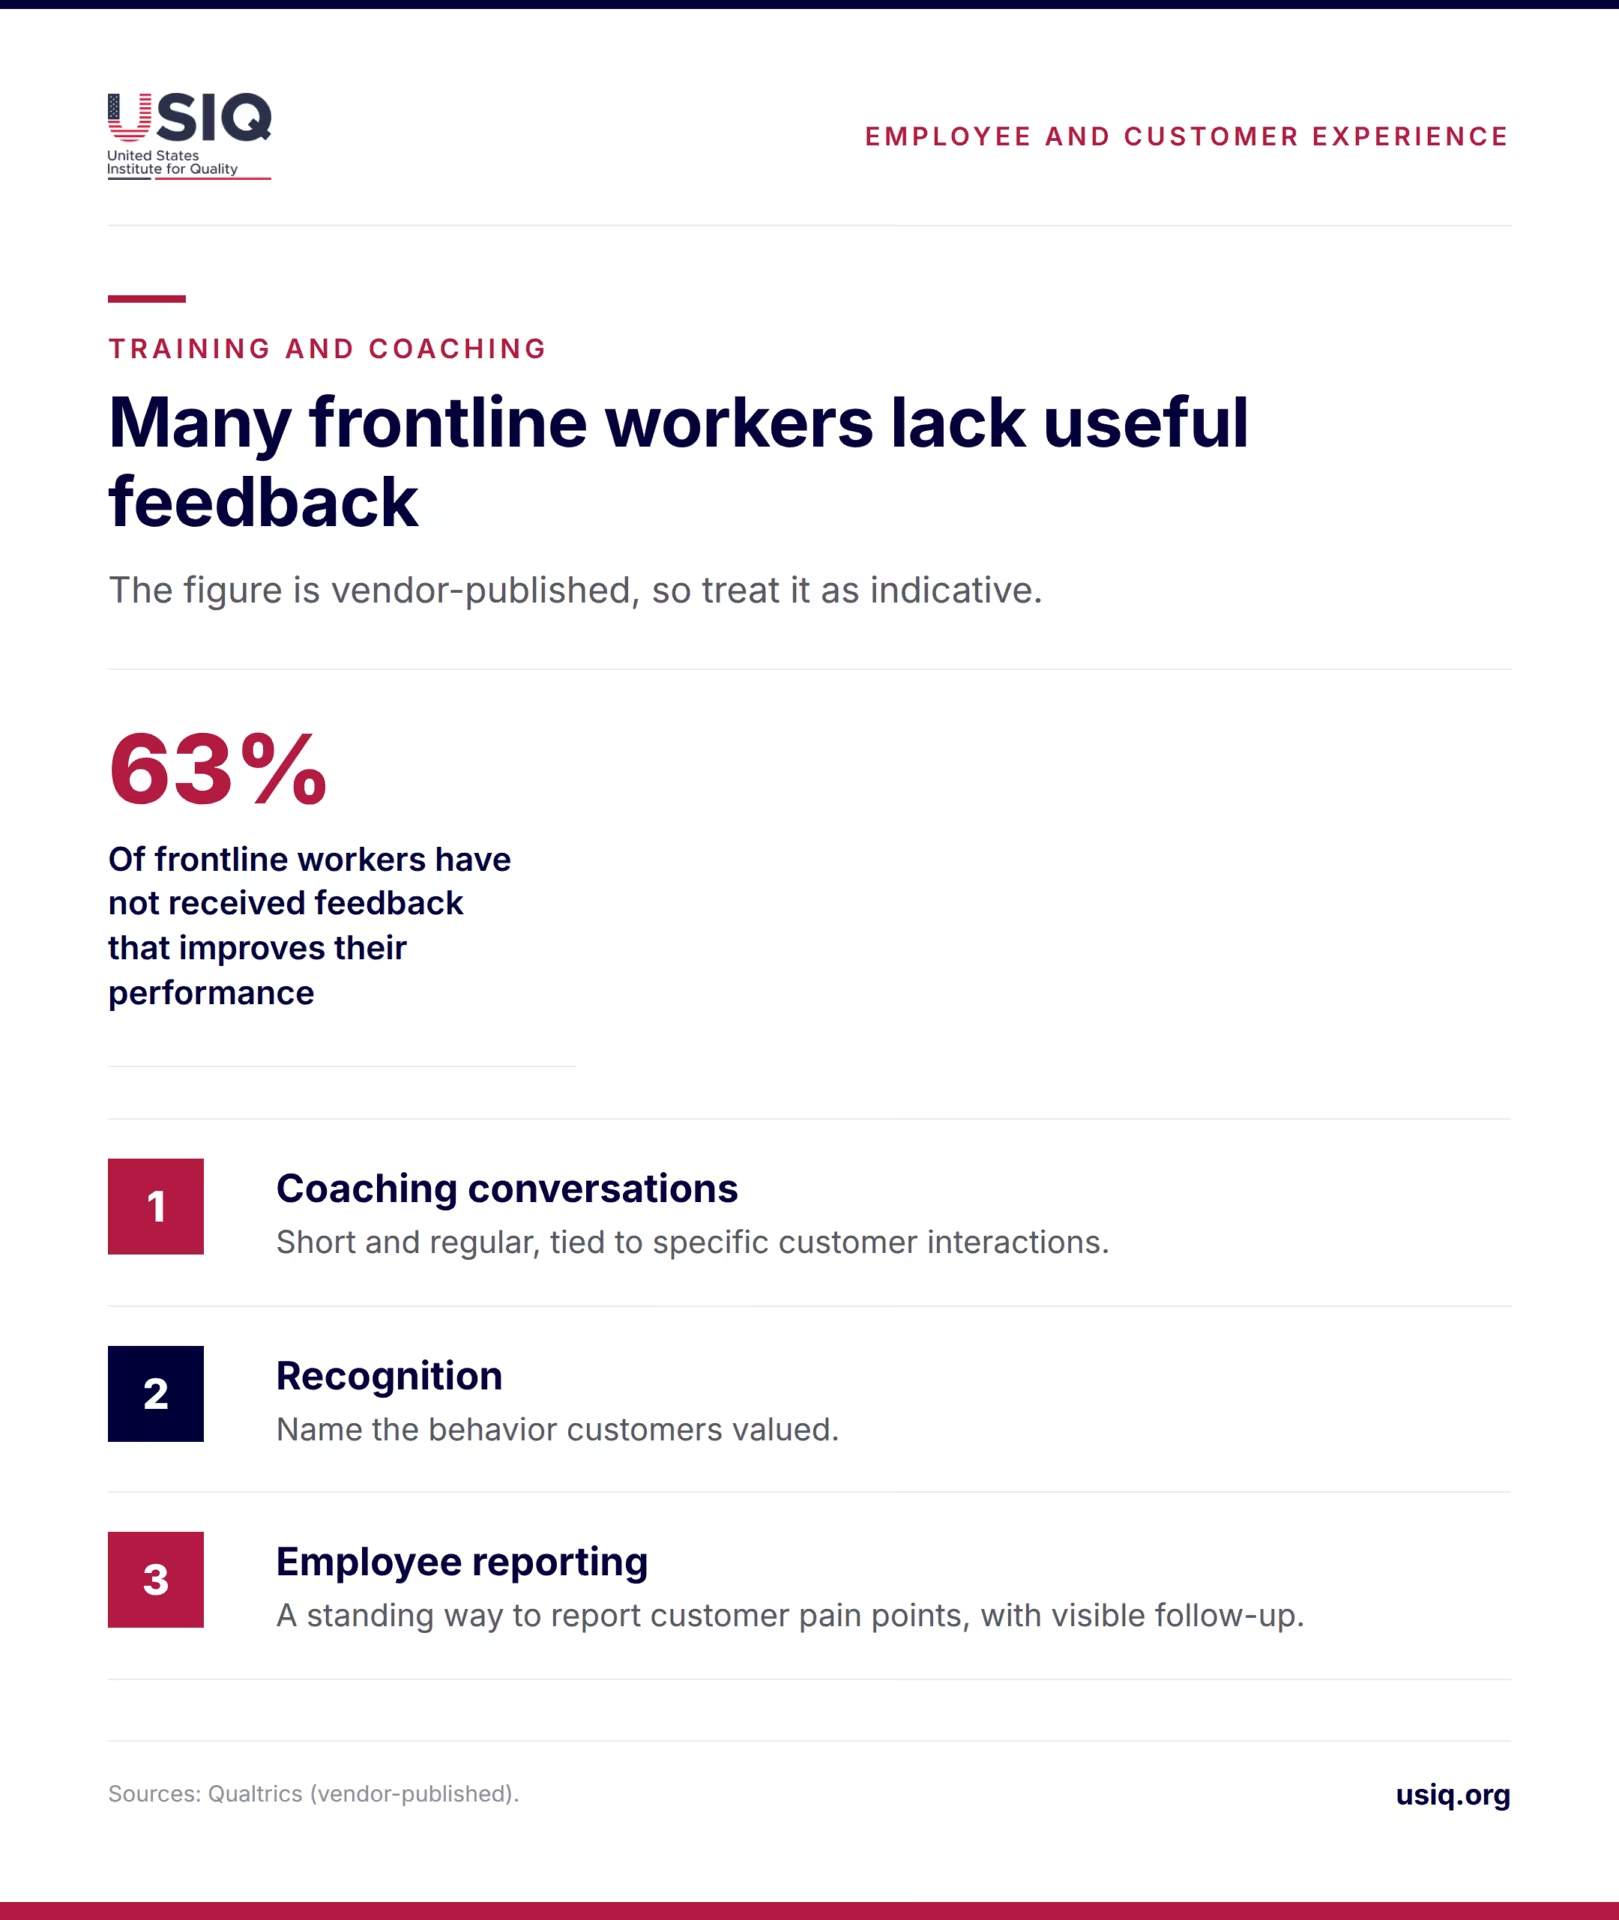
Training is where company standards become daily behavior. Qualtrics, a survey software vendor, reports that 63% of front line workers say they have not received feedback that improves their performance (Qualtrics). Because the figure is vendor-published, treat it as indicative rather than definitive.
The same source argues that middle managers deliver training, set expectations and model culture. That matches common experience: a front line employee’s idea of “good service” usually comes from the supervisor on shift, not from a handbook.
Low-cost routines can close part of the gap:
- Short, regular coaching conversations tied to specific customer interactions.
- Recognition that names the behavior customers valued.
- A standing way for employees to report what frustrates customers, with visible follow-up.
USIQ has covered how managers shape engagement in more detail in its guide to employee engagement best practices for U.S. employers.
What workplace conditions can employers control that customers notice?
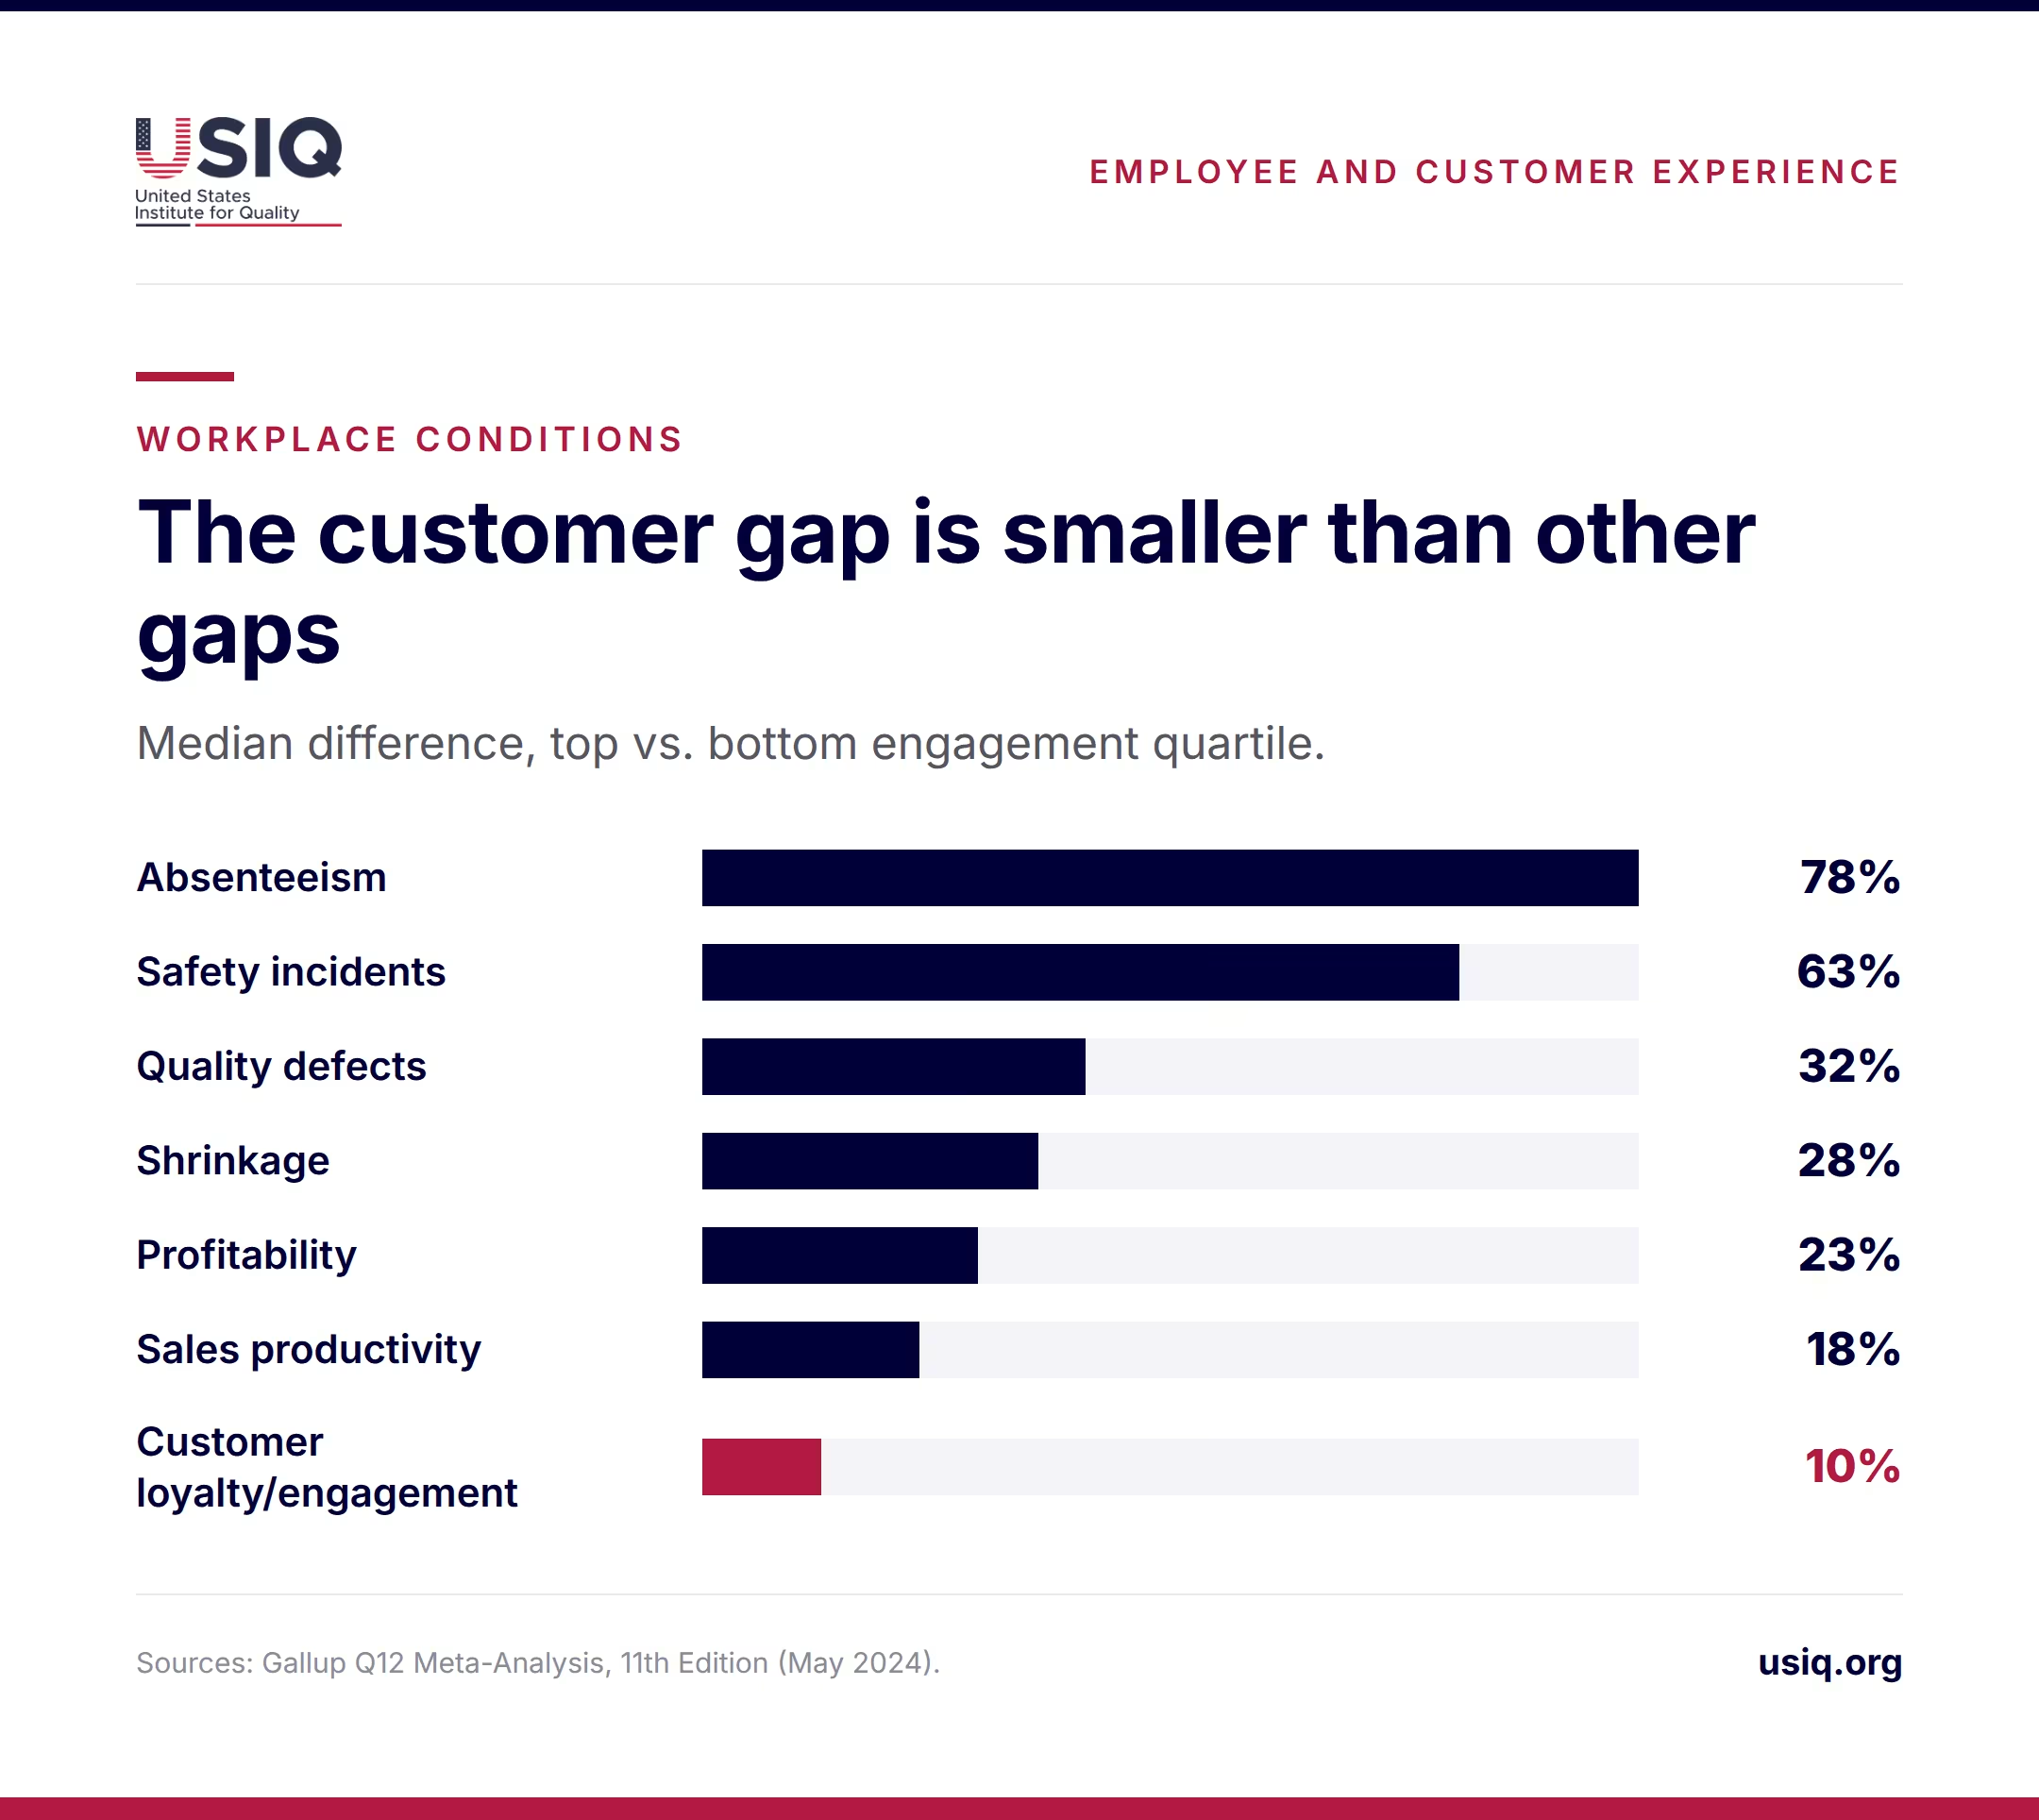
Conditions show up in customer-facing outcomes more often than owners expect. Gallup’s comparison of top- and bottom-quartile engagement units found median differences of 78% in absenteeism, 63% in safety incidents, 32% in quality defects and 28% in shrinkage (Gallup). Absenteeism leaves shifts short, and quality defects reach customers directly.
| Outcome | Median difference, top vs. bottom engagement quartile |
|---|---|
| Absenteeism | 78% |
| Safety incidents | 63% |
| Quality defects | 32% |
| Shrinkage (theft) | 28% |
| Profitability | 23% |
| Sales productivity | 18% |
| Customer loyalty/engagement | 10% |
Operations matter as well as morale. In the car rental study, the engagement effect weakened when service disruptions occurred, such as customers receiving a downgraded car, but it stayed positive. The authors read this as a sign that engaged employees help most in service recovery (Quantitative Marketing and Economics).
Scheduling practices, wage-and-hour compliance and workplace safety rules also shape conditions, and requirements vary by state and city. Employers should check current rules with their state labor agency, the U.S. Department of Labor or qualified counsel before changing scheduling or pay practices.
Is the link between employee experience and customer experience over-hyped?
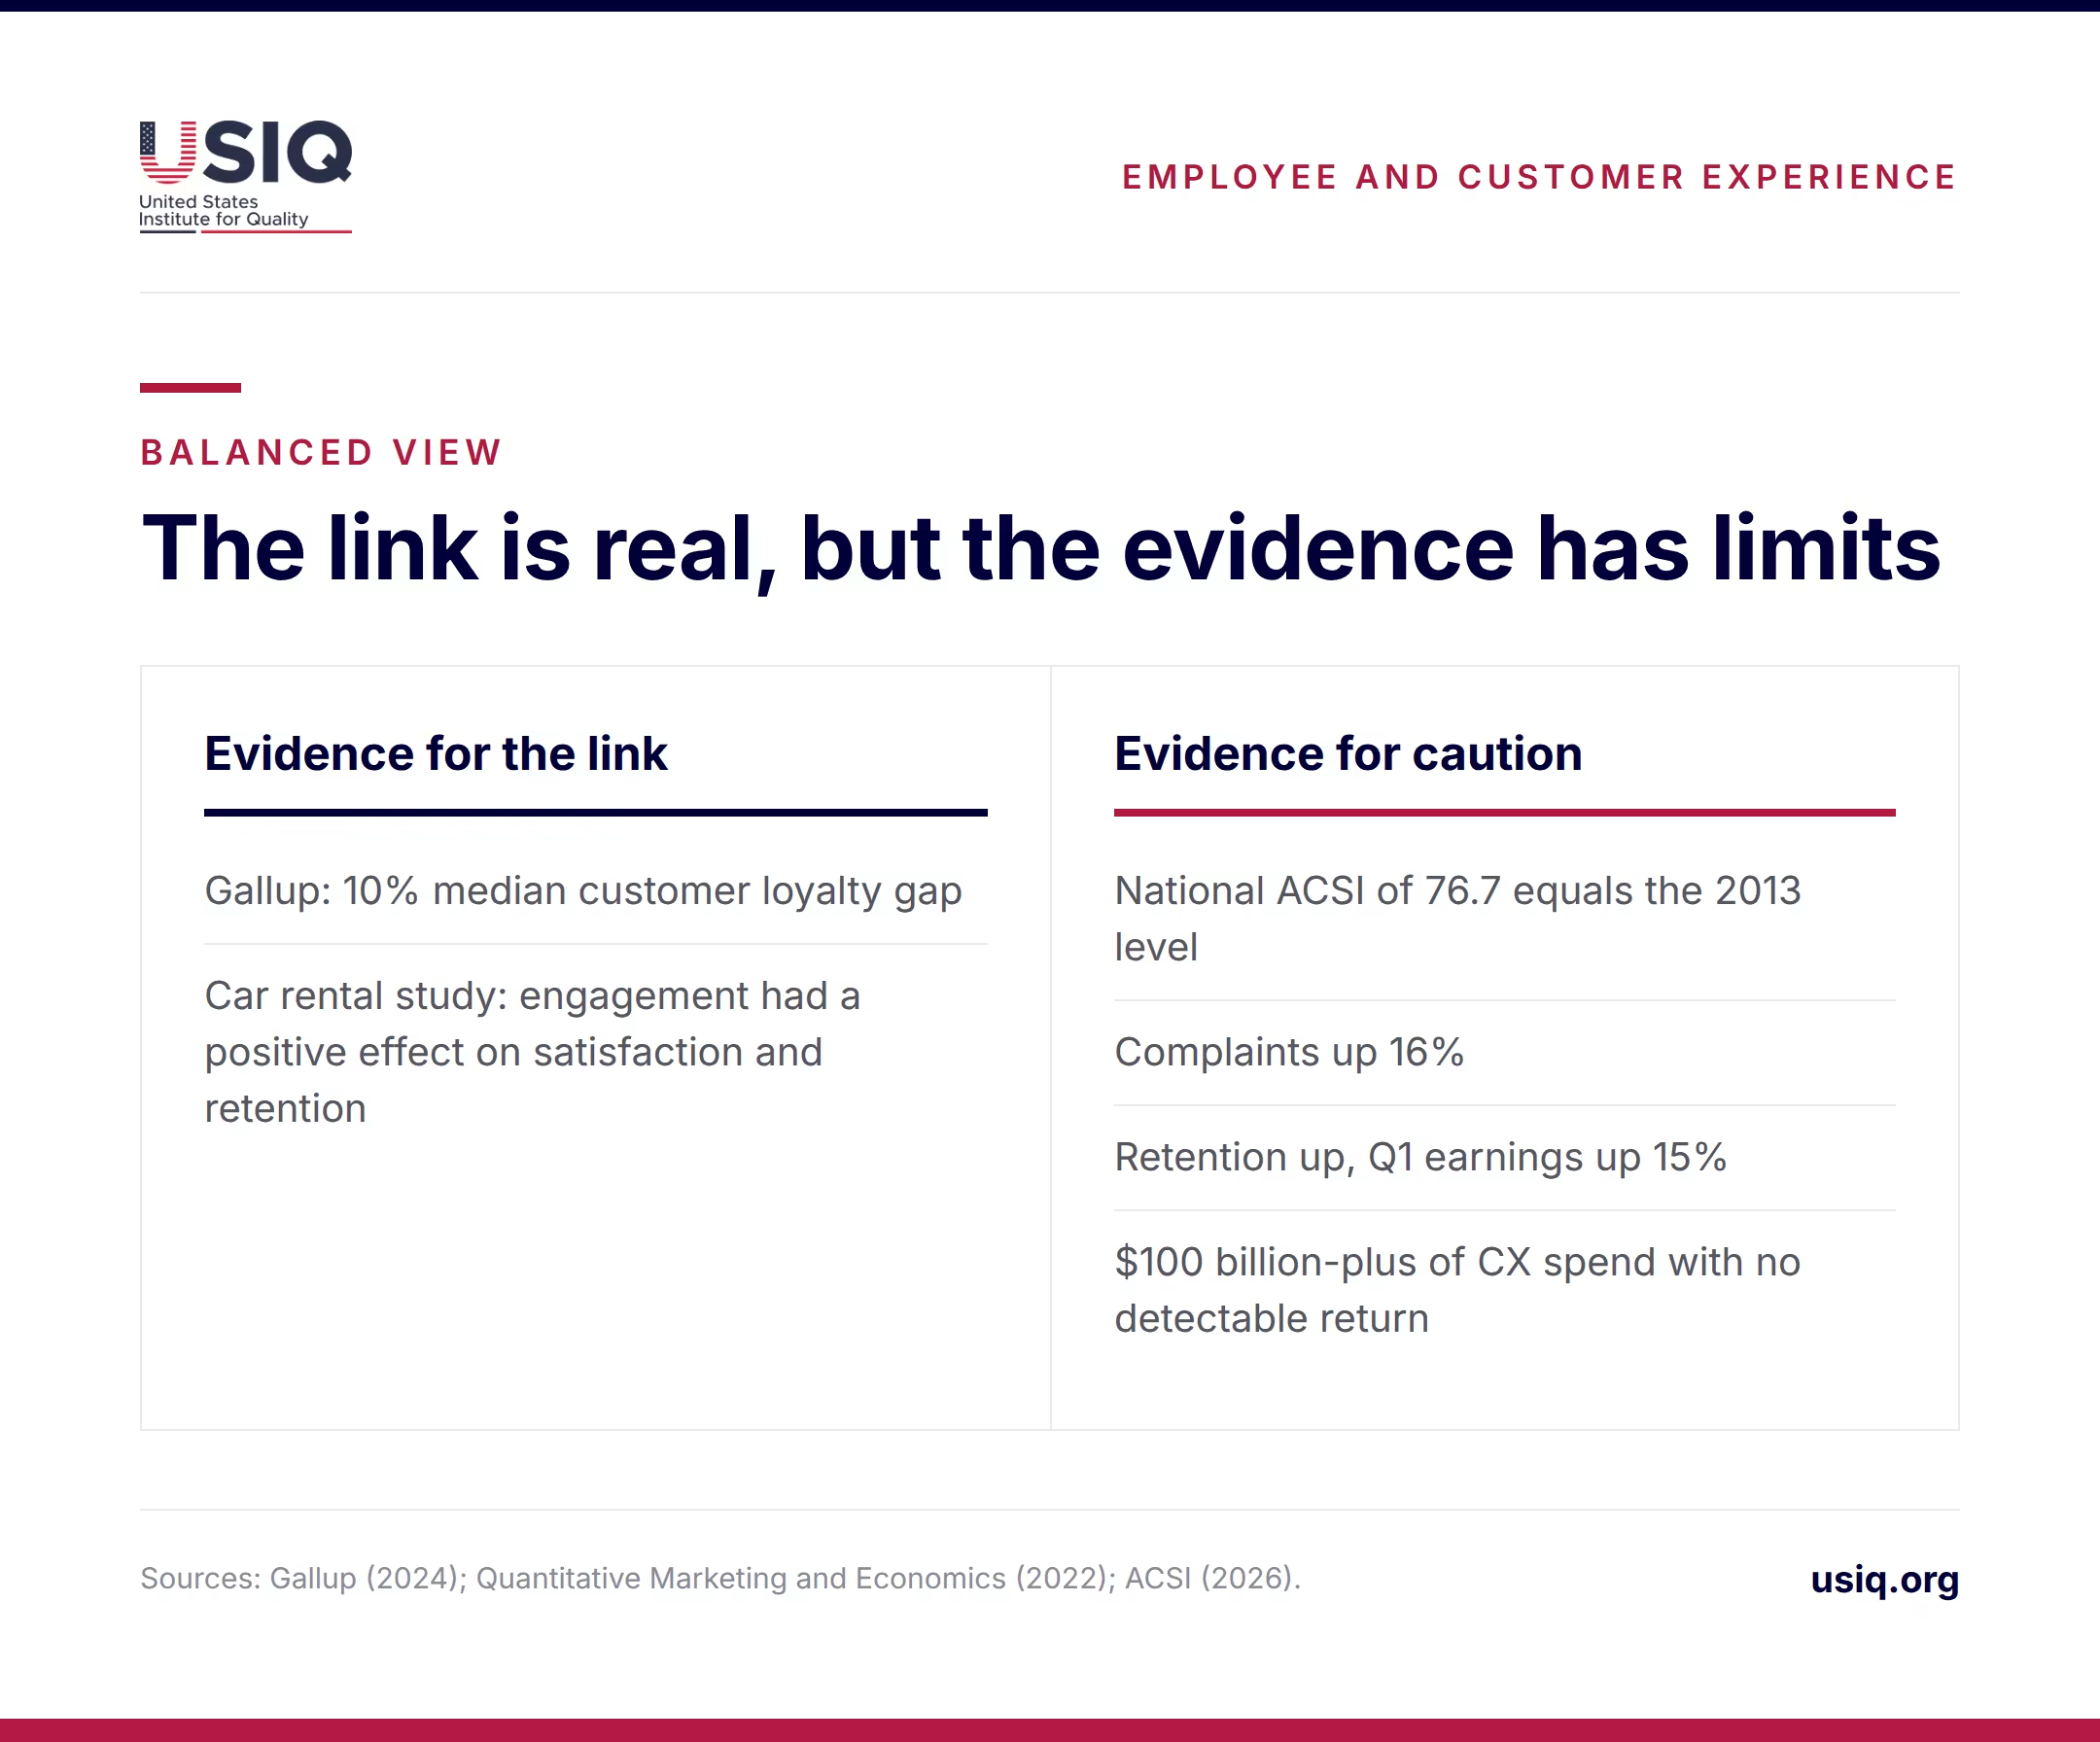
Partly. The American Customer Satisfaction Index reported that the national ACSI fell 0.3% to 76.7 on a 100-point scale in Q1 2026, the same level as in 2013 (ACSI).
The same release says customer complaints reached record levels, up 16%, while customer retention rose and Q1 earnings grew 15%. It also says an estimated $100 billion-plus of CX investment shows no detectable return, and argues spending should shift toward metrics tied to revenue and profit.
Read together with the earlier evidence, the issue is measurement. Engagement is associated with better customer outcomes, yet satisfaction can stay flat while retention rises. Unit-level engagement data is also correlational: well-run locations may have both engaged staff and happy customers because of something else, such as good management or a strong local market.
Three misconceptions follow from this:
- Engagement guarantees satisfaction. It does not; disruptions dampen the effect.
- More CX spending means better results. The ACSI reports no detectable return on aggregate spending.
- The customer effect is the biggest payoff. In Gallup’s data, the customer gap (10%) is smaller than the gaps in absenteeism, safety and quality.
How can a small or mid-sized employer connect employee experience and customer experience data?
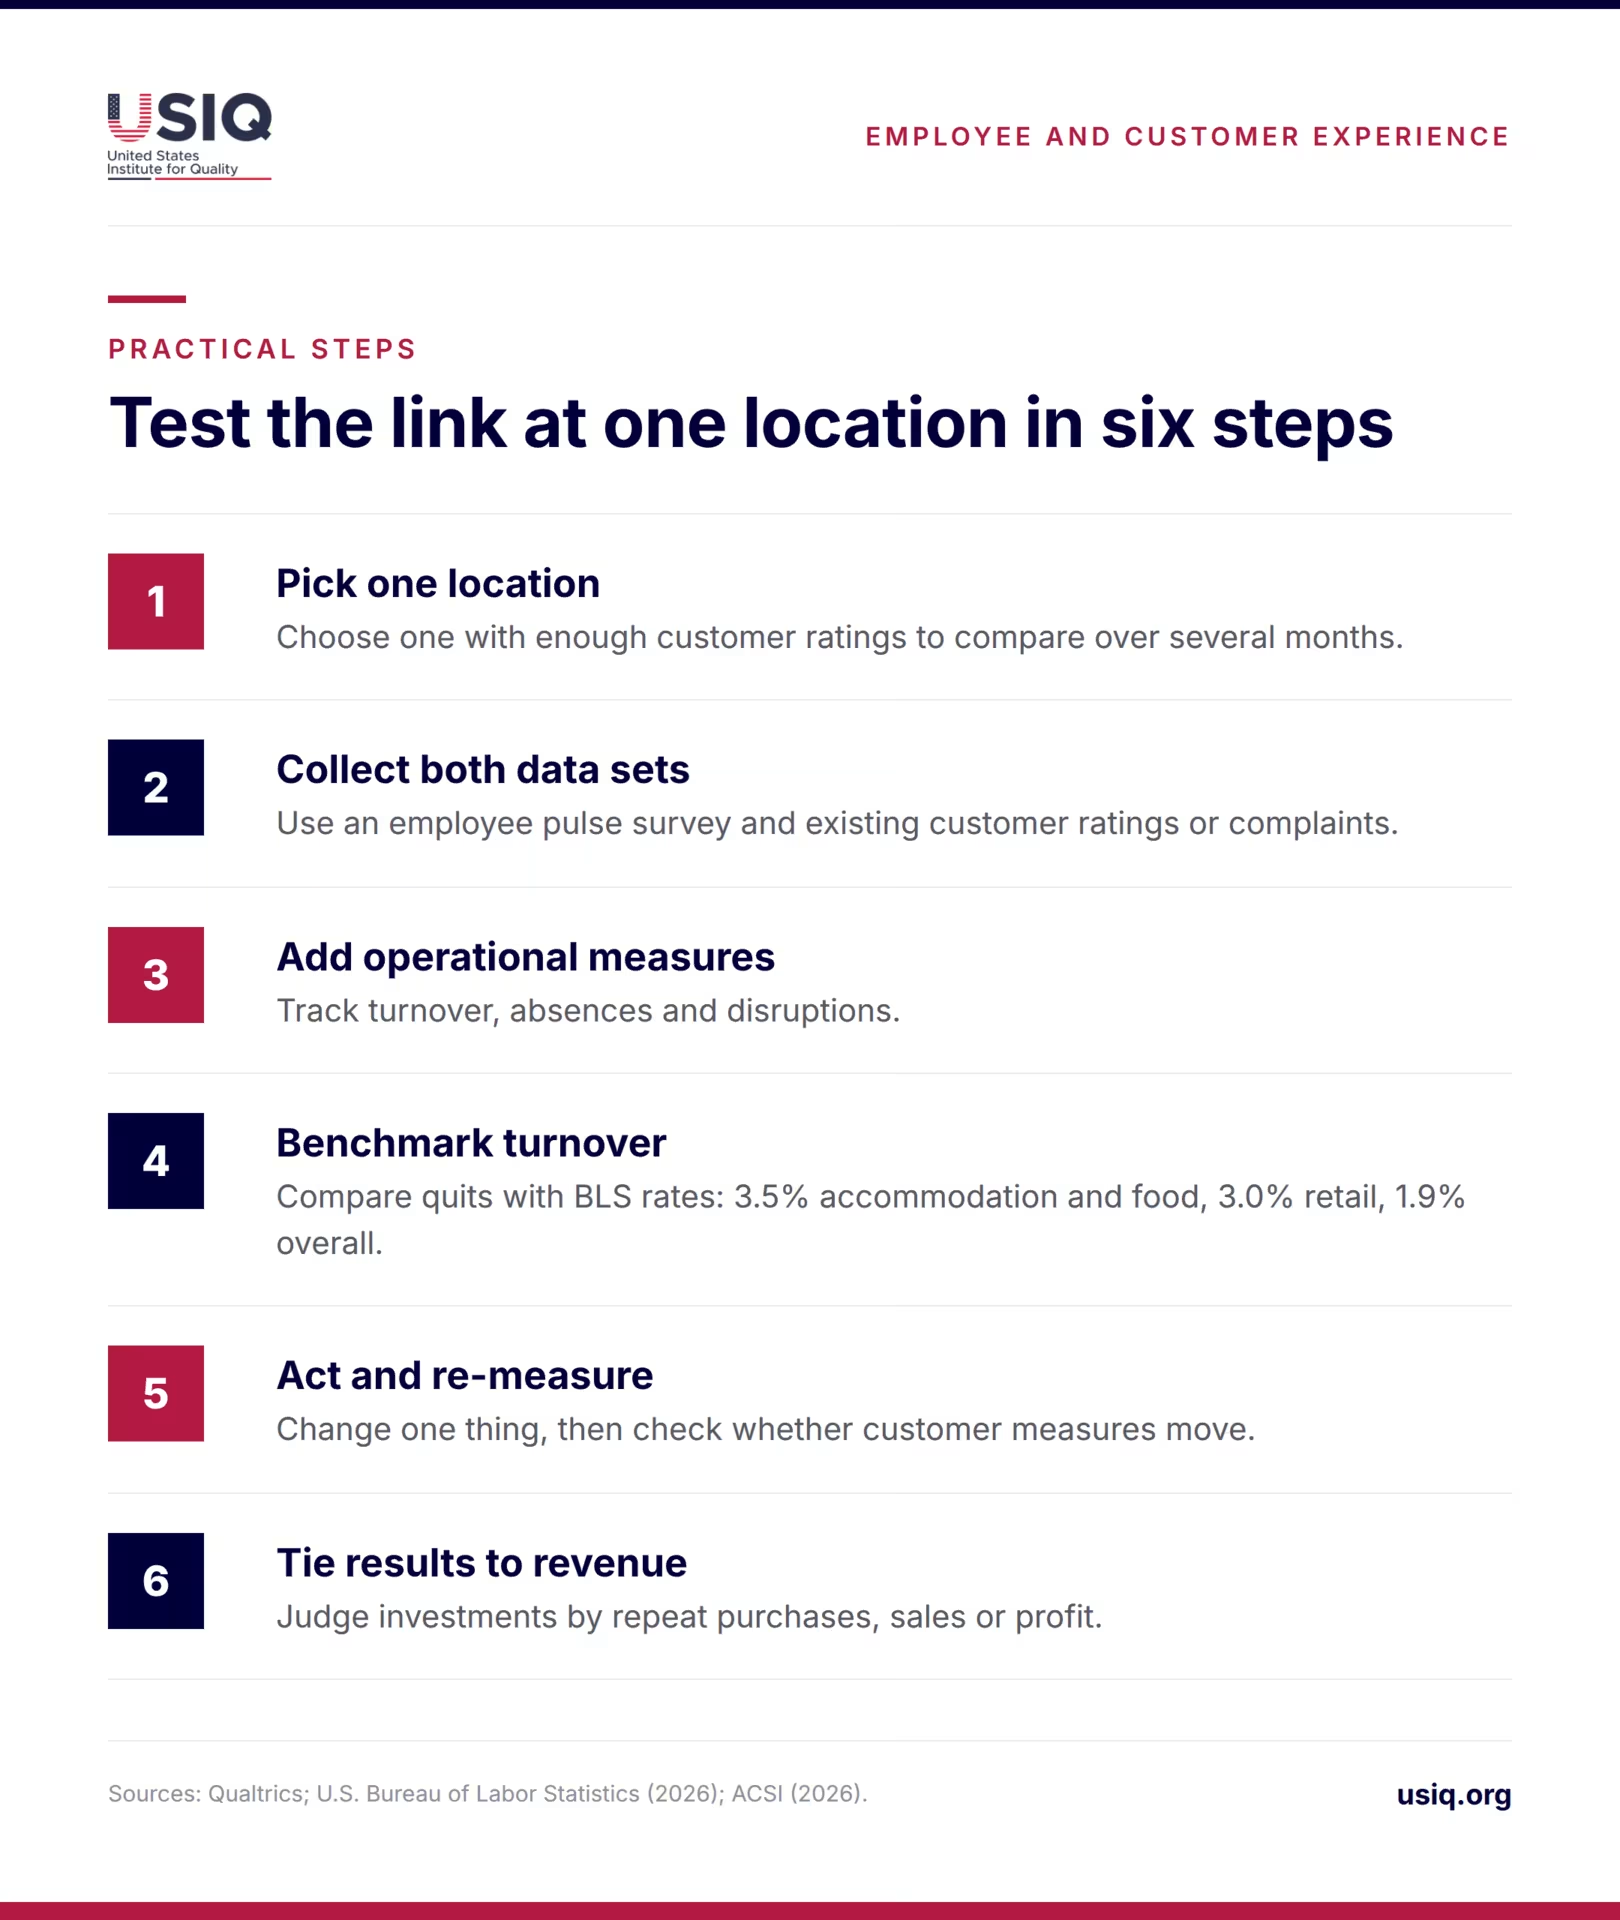
Qualtrics advises linking EX and CX data starting with a single team or location. That scale suits smaller firms, which rarely have the volume for company-wide statistical models.
- Pick one location or team. Choose one with enough customer ratings to compare over several months.
- Collect both data sets. Use a short employee pulse survey and the customer ratings or complaints you already have.
- Add operational measures. Track turnover, absences and disruptions such as stock-outs or long waits.
- Benchmark turnover. Compare your quits against the BLS industry rates, such as 3.5% for accommodation and food services or 3.0% for retail.
- Act and re-measure. Change one thing, such as coaching cadence or scheduling, then check whether customer measures move.
- Tie the result to revenue. Follow the ACSI’s advice and judge investments by repeat purchases, sales or profit rather than scores alone.
Acting on survey feedback matters as much as collecting it, because employees who see no response stop answering. For background on building the engagement side, see USIQ’s piece on employee engagement as the key to a thriving workplace and its look at employer branding examples.
How does the connection differ by industry and company size?
Industry matters mainly through turnover and customer contact. A hotel or restaurant with a 3.5% monthly quits rate rebuilds its front line constantly, while a manufacturer at 1.6% rarely does, though even that rate is up from 1.3% a year earlier. For retail and other services, the year-over-year rise in quits suggests the pressure is growing.
Company size changes the method more than the principle. Large chains can compare dozens of locations, while a small firm may have one site and a handful of staff, where direct conversations and a simple tracking sheet do the work of a survey platform. The published research does not separate the effect by company size, so an employer’s own data is the best evidence of how the link works in its business.
What is the outlook, and what should employers do first?
Customer satisfaction nationally sits at its 2013 level, retention is up and complaints are at a record. That mixed picture suggests customers may be staying for reasons beyond satisfaction, and that employers who deliver consistent service have room to stand out.
The sensible first step is to treat the link as a hypothesis and test it at one location. Staffing stability, coaching and operational reliability are the first levers to adjust, and revenue is the final measure.
FAQ
What is the difference between employee experience and customer experience?
Employee experience covers what people encounter at work, including schedules, managers, training, tools and conditions. Customer experience covers what customers encounter when they buy from or deal with the company. The two overlap at the front line, where employees deliver the service that customers rate.
Is there proof that engaged employees improve customer loyalty?
There is supporting evidence. Gallup found a median 10% customer loyalty and engagement gap between top- and bottom-quartile engagement units, and a car rental study found engagement raised satisfaction and retention. That paper also describes support for the framework it examined as “purely correlational,” so results will vary.
Which industries lose employees fastest?
In August 2026, BLS reported quits rates of 3.5% in accommodation and food services, 3.0% in retail trade and 2.7% in other services. The total non farm rate was 1.9%, and manufacturing was 1.6%. Customer-facing sectors therefore carry the highest turnover pressure.
Does training really change customer service?
Training sets the standard for daily behavior, and feedback is where many employers fall short. Qualtrics reports that 63% of front line workers have not received feedback that improves their performance. That is vendor data, but it points to coaching as a practical, low-cost lever for managers.
Can engaged employees make up for poor processes?
Only partly. In the car rental study, the positive effect of engagement weakened when service disruptions occurred, though it stayed positive. Engaged employees appear to help with service recovery, but employers still need reliable operations, stock, systems and staffing to deliver consistently.
Does spending on customer experience pay off?
Not reliably, according to the ACSI. It says an estimated $100 billion-plus of CX investment shows no detectable return, and it urges a shift toward metrics tied to revenue and profit. Employers should judge any program by sales, repeat purchases and profit, not by survey scores alone.
How can a small business measure the connection?
Start with one location or team. Pair a short employee survey with the customer ratings, complaints and turnover figures you already have, then compare over several months. Change one practice at a time, such as coaching or scheduling, and check whether customer measures and sales respond.
Do scheduling and wage rules affect this topic?
They can, because schedules, pay practices and safety are part of workplace conditions. Rules differ by state and city, so employers should check current requirements with their state labor agency, the U.S. Department of Labor or qualified counsel before changing how they schedule or pay front line staff.
Sources
- Gallup, “Q12 Meta-Analysis, 11th Edition,” May 2024 (updated July 2024): https://www.gallup.com/workplace/321725/gallup-q12-meta-analysis-report.aspx
- Khwaja and Yang, “Quantifying the link between employee engagement, and customer satisfaction and retention in the car rental industry,” Quantitative Marketing and Economics, June 13, 2022: https://link.springer.com/article/10.1007/s11129-022-09253-6
- U.S. Bureau of Labor Statistics, The Economics Daily, “Quits rate 3.5 percent in accommodation and food services, August 2026,” October 13, 2026: https://www.bls.gov/opub/ted/2026/quits-rate-3-5-percent-in-accommodation-and-food-services-august-2026.htm
- American Customer Satisfaction Index, “Press Release National ACSI Q1 2026,” May 12, 2026: https://theacsi.com/news-and-resources/press-releases/2026/05/12/press-release-national-acsi-q1-2026/
- Qualtrics, “Customer Experience and Employee Experience” (vendor-published, undated): https://www.qualtrics.com/articles/customer-experience/cx-employee-engagement/


Related Articles
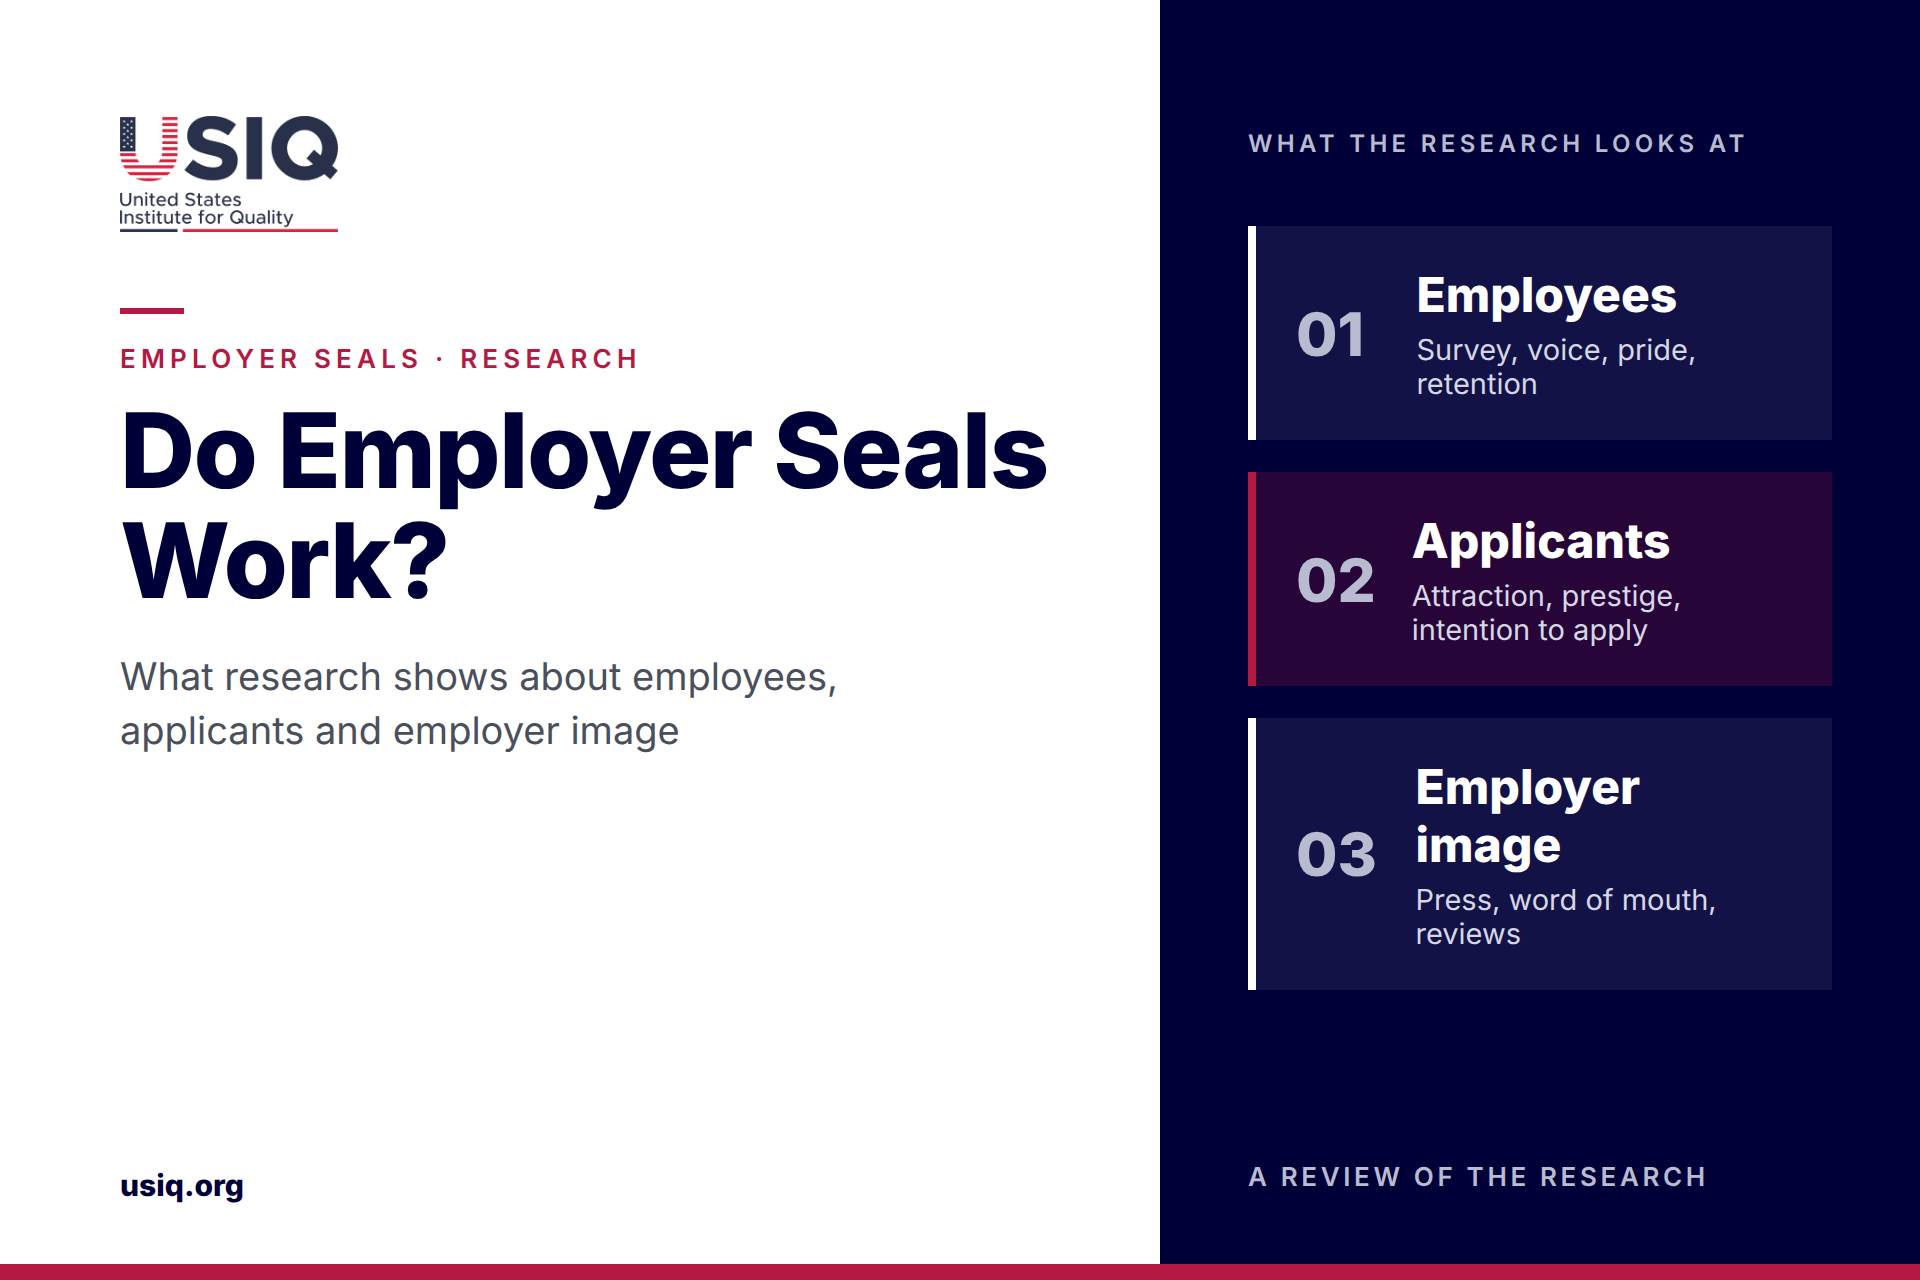
What research says about the effects of employer seals on current employees, potential applicants and employer image, from independent experiments and field data to the limits of the evidence.
Employee experience and customer experience are linked, but the link is weaker and more conditional than popular slogans suggest. This article reviews the evidence on staffing, training and workplace conditions and shows how employers can test the connection in their own business.
Most HR dashboards show too many metrics and trigger too few decisions. This guide defines ten employee experience metrics, shows a one-page layout and explains how to read your numbers against U.S. data.
A practical guide to calculating marketing ROI for small and mid-sized U.S. companies, including long B2B sales cycles, offline leads, a spreadsheet walkthrough and common errors.