

- Key takeaways
- What is marketing ROI, and how do you calculate it?
- What is the difference between ROI and ROAS?
- How do CAC, lifetime value and payback period fit in?
- How do you measure marketing ROI when B2B sales cycles are long?
- How do you track offline, local, call and referral leads?
- Which simple attribution method should a small business use?
- What is a good marketing ROI for a company your size?
- How do you build a marketing ROI spreadsheet?
- How should you report marketing ROI to leadership?
- What are the most common marketing ROI mistakes?
- What are the limits of marketing ROI?
- What should you do first?
- The bottom line
- Frequently asked questions
- What is the formula for marketing ROI?
- Is ROAS the same as ROI?
- How do I measure ROI on marketing that does not produce instant sales?
- How can I track leads from referrals and phone calls?
- Do I need to record calls to use call tracking?
- Why do ad platform numbers differ from my sales records?
- How often should I review marketing ROI?
- Sources
Most owners know roughly what they spend on marketing. Far fewer can say which part of that spend produced a paying customer. Marketing ROI is the tool that closes that gap, but the basic formula in most articles hides more than it shows.
A plumber who gets leads by phone, a software reseller with a seven-month sales cycle and a boutique with a loyalty program all face different measurement problems. Revenue, profit, timing and tracking each distort the result in their own way. This guide covers the formulas, the worked numbers and the practical tracking methods a small U.S. business can run in a spreadsheet.
One note on the numbers. All dollar figures in the examples are hypothetical and chosen to make the arithmetic easy to follow. They are not benchmarks. Your own historical data is the right yardstick, and the section on company size explains how to build it.
Quick answer: Marketing ROI equals gross profit attributable to marketing, minus total marketing cost, divided by that cost. Use profit rather than revenue, count labor and tool costs, and review results by channel and customer cohort. Pair ROI with customer acquisition cost and payback period to see cash-flow effects.
Key takeaways
- Calculate marketing ROI on gross profit, not revenue, and include staff time, agency fees and software.
- ROAS measures revenue per ad dollar. It ignores margin and non-ad costs, so it can make a losing channel look healthy.
- Customer acquisition cost (CAC) and payback period show how fast spend returns as cash, which matters more to small firms than a percentage.
- Long B2B sales cycles require cohort reviews and pipeline-stage tracking instead of month-by-month ROI.
- Offline and local channels can be tracked with call tracking numbers, promo codes, referral fields and a “how did you hear about us” question.
- Privacy settings limit what ad platforms can see, so treat platform-reported conversions as a claim to check against your CRM and sales records.
- Report results on one page, state your assumptions and separate short-term returns from long-term effects.
What is marketing ROI, and how do you calculate it?
Marketing ROI compares what marketing returned with what it cost. The formula is: (gross profit attributable to marketing − total marketing cost) ÷ total marketing cost, usually shown as a percentage. An ROI of 100% means every dollar spent came back plus another dollar of profit. An ROI of 0% means break-even, and a negative figure means a loss.
Two choices decide whether the number means anything. The first is the return side. Gross profit (revenue minus the direct cost of delivering the product or service) is the honest measure. Revenue-based ROI overstates results, especially in low-margin businesses such as retail, construction and distribution.
The second is the cost side. Count everything you would not spend if you stopped marketing: ad spend, agency or freelancer fees, software subscriptions, creative production, printing, event fees and the share of employee time spent on campaigns. Many small businesses count only the ad invoice, which flatters the result.
A worked example
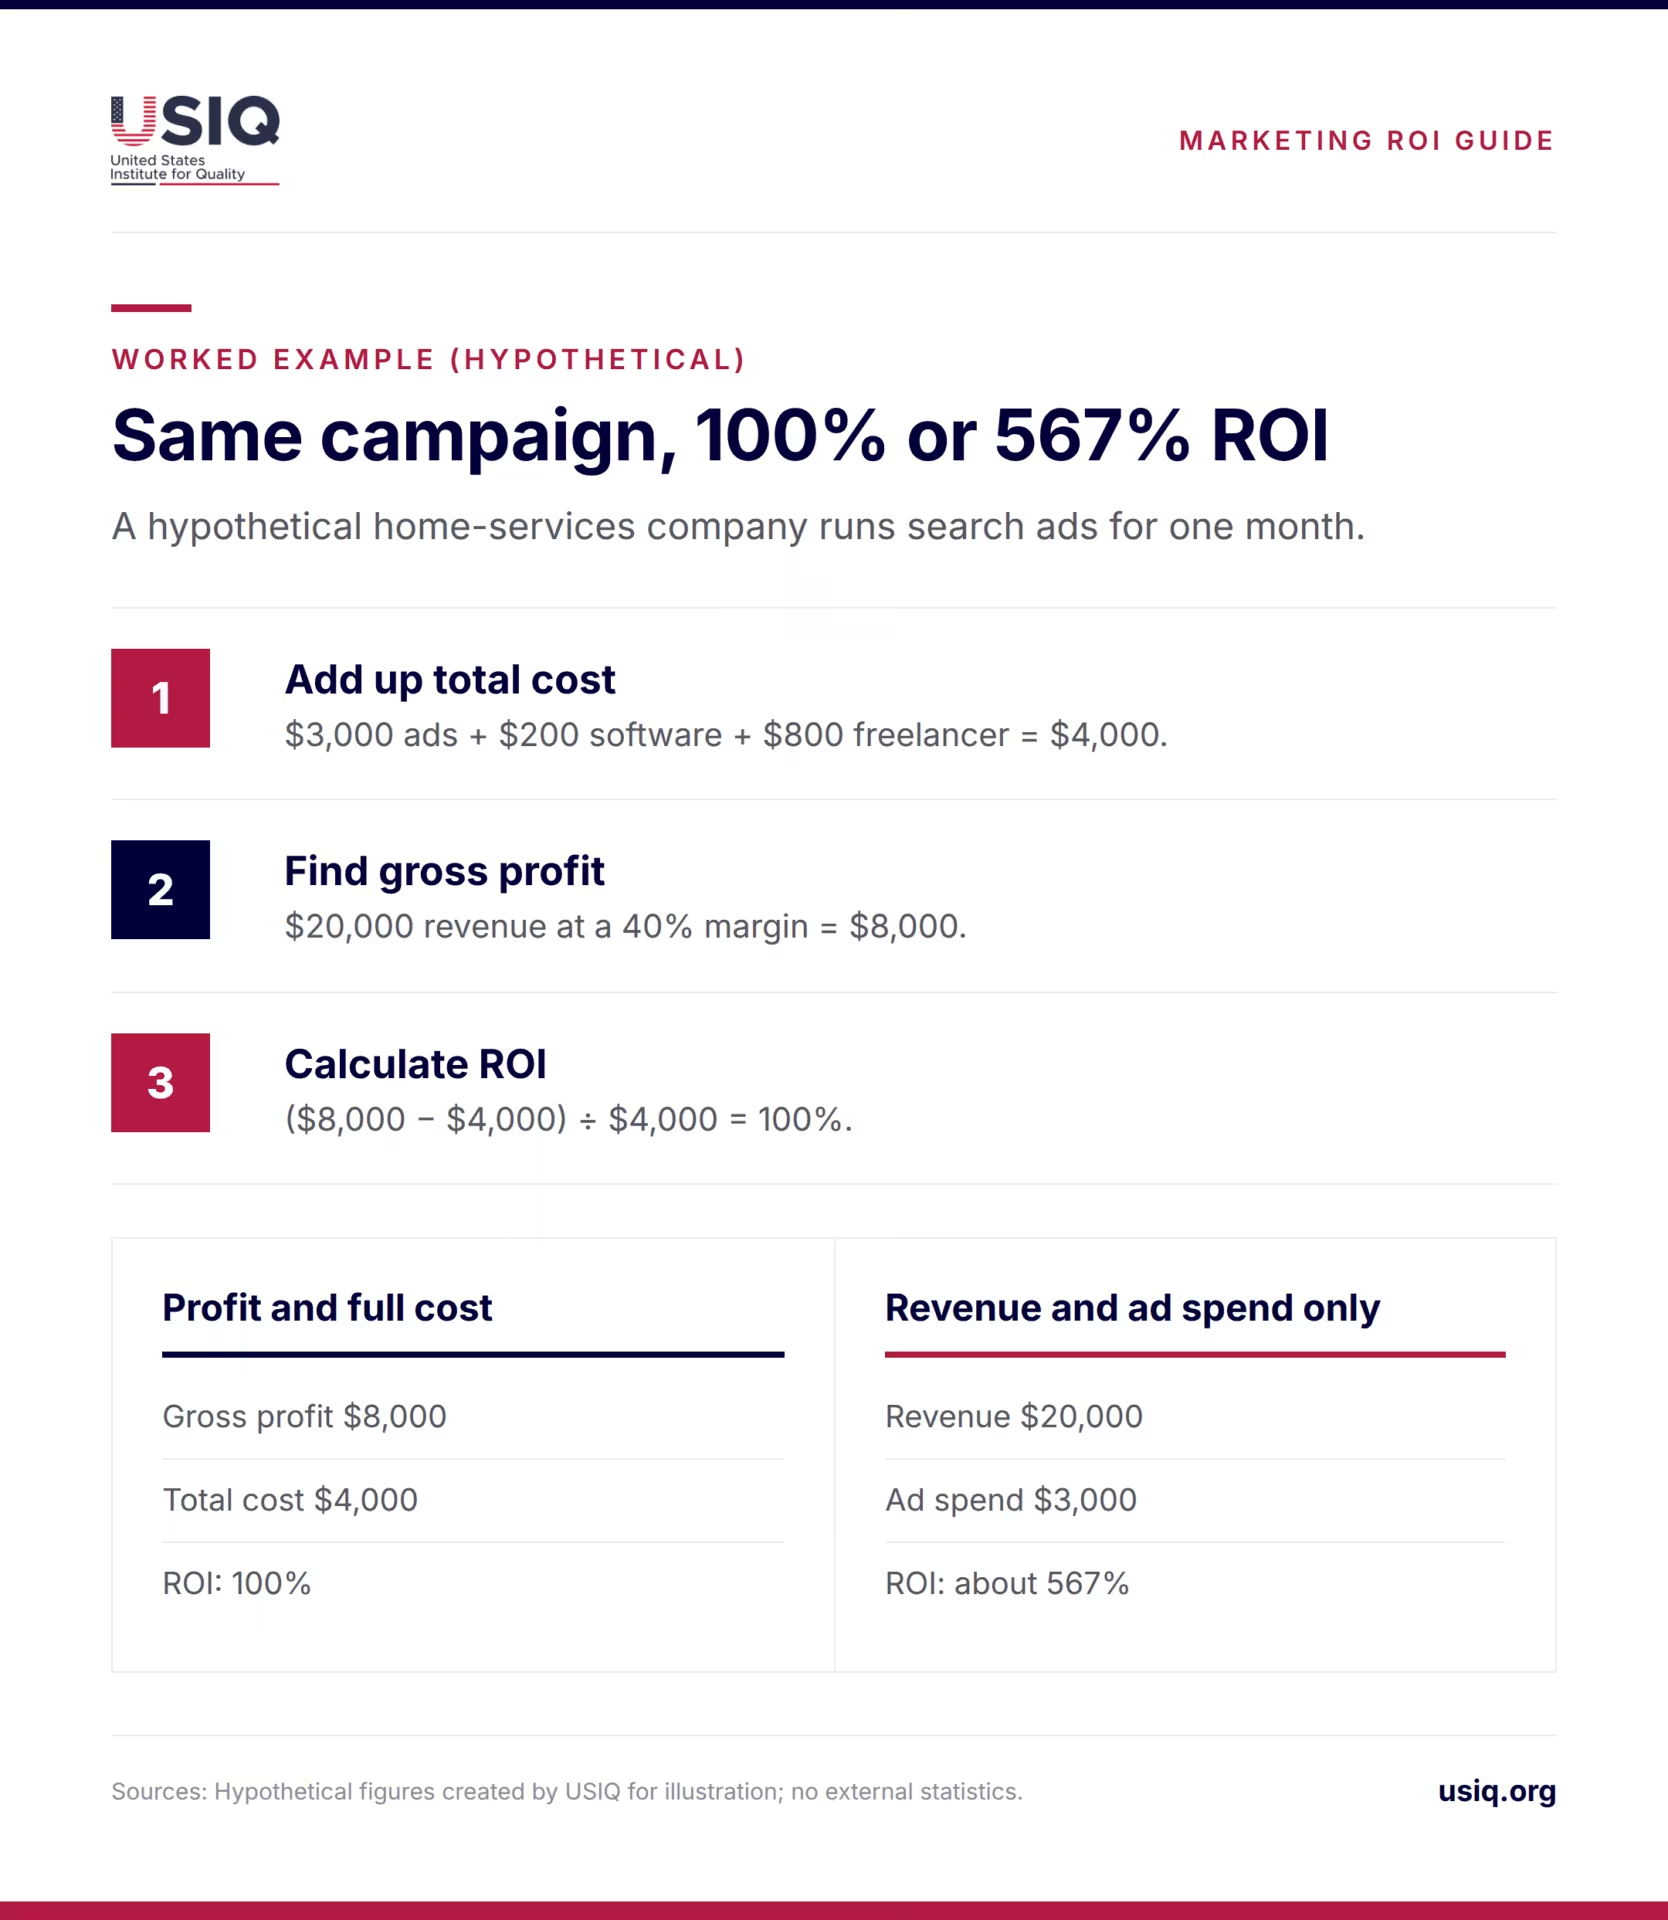
Take a hypothetical home-services company running search ads for one month. It spends $3,000 on ads, $200 on tracking software and $800 on a freelancer who manages the campaign, for a total cost of $4,000. The ads produce 40 leads and 10 booked jobs worth $20,000 in revenue. With a 40% gross margin, gross profit is $8,000.
ROI is ($8,000 − $4,000) ÷ $4,000 = 100%. Had the owner used revenue and counted only ad spend, the figure would have been ($20,000 − $3,000) ÷ $3,000, or about 567%. Same campaign, very different story.
What is the difference between ROI and ROAS?
Return on ad spend (ROAS) is revenue divided by ad spend. In the example above, $20,000 ÷ $3,000 gives a ROAS of about 6.7. It is quick to compute and ad platforms report it by default, which is why many owners lean on it.
The problem is what ROAS leaves out. It ignores product margin, labor, software and agency fees. A ROAS of 6.7 sounds excellent, yet at a 40% margin the campaign only doubled its money. A retailer with a 15% margin would lose money at the same ROAS: $6.70 of revenue yields about $1.00 of gross profit per ad dollar, before any other cost.
Use ROAS for day-to-day ad adjustments, such as comparing two ad groups with the same margin. Use ROI for budget decisions between channels and for anything you present to an owner, a lender or a board.
How do CAC, lifetime value and payback period fit in?
ROI is a ratio. It does not say how long the money was tied up or how much a customer is worth after the first sale. Three companion metrics fill that in.
- Customer acquisition cost (CAC): total sales and marketing cost in a period divided by new customers won in that period.
- Customer lifetime value (LTV): the gross profit a customer is expected to generate over the whole relationship.
- Payback period: months of gross profit needed to recover CAC.
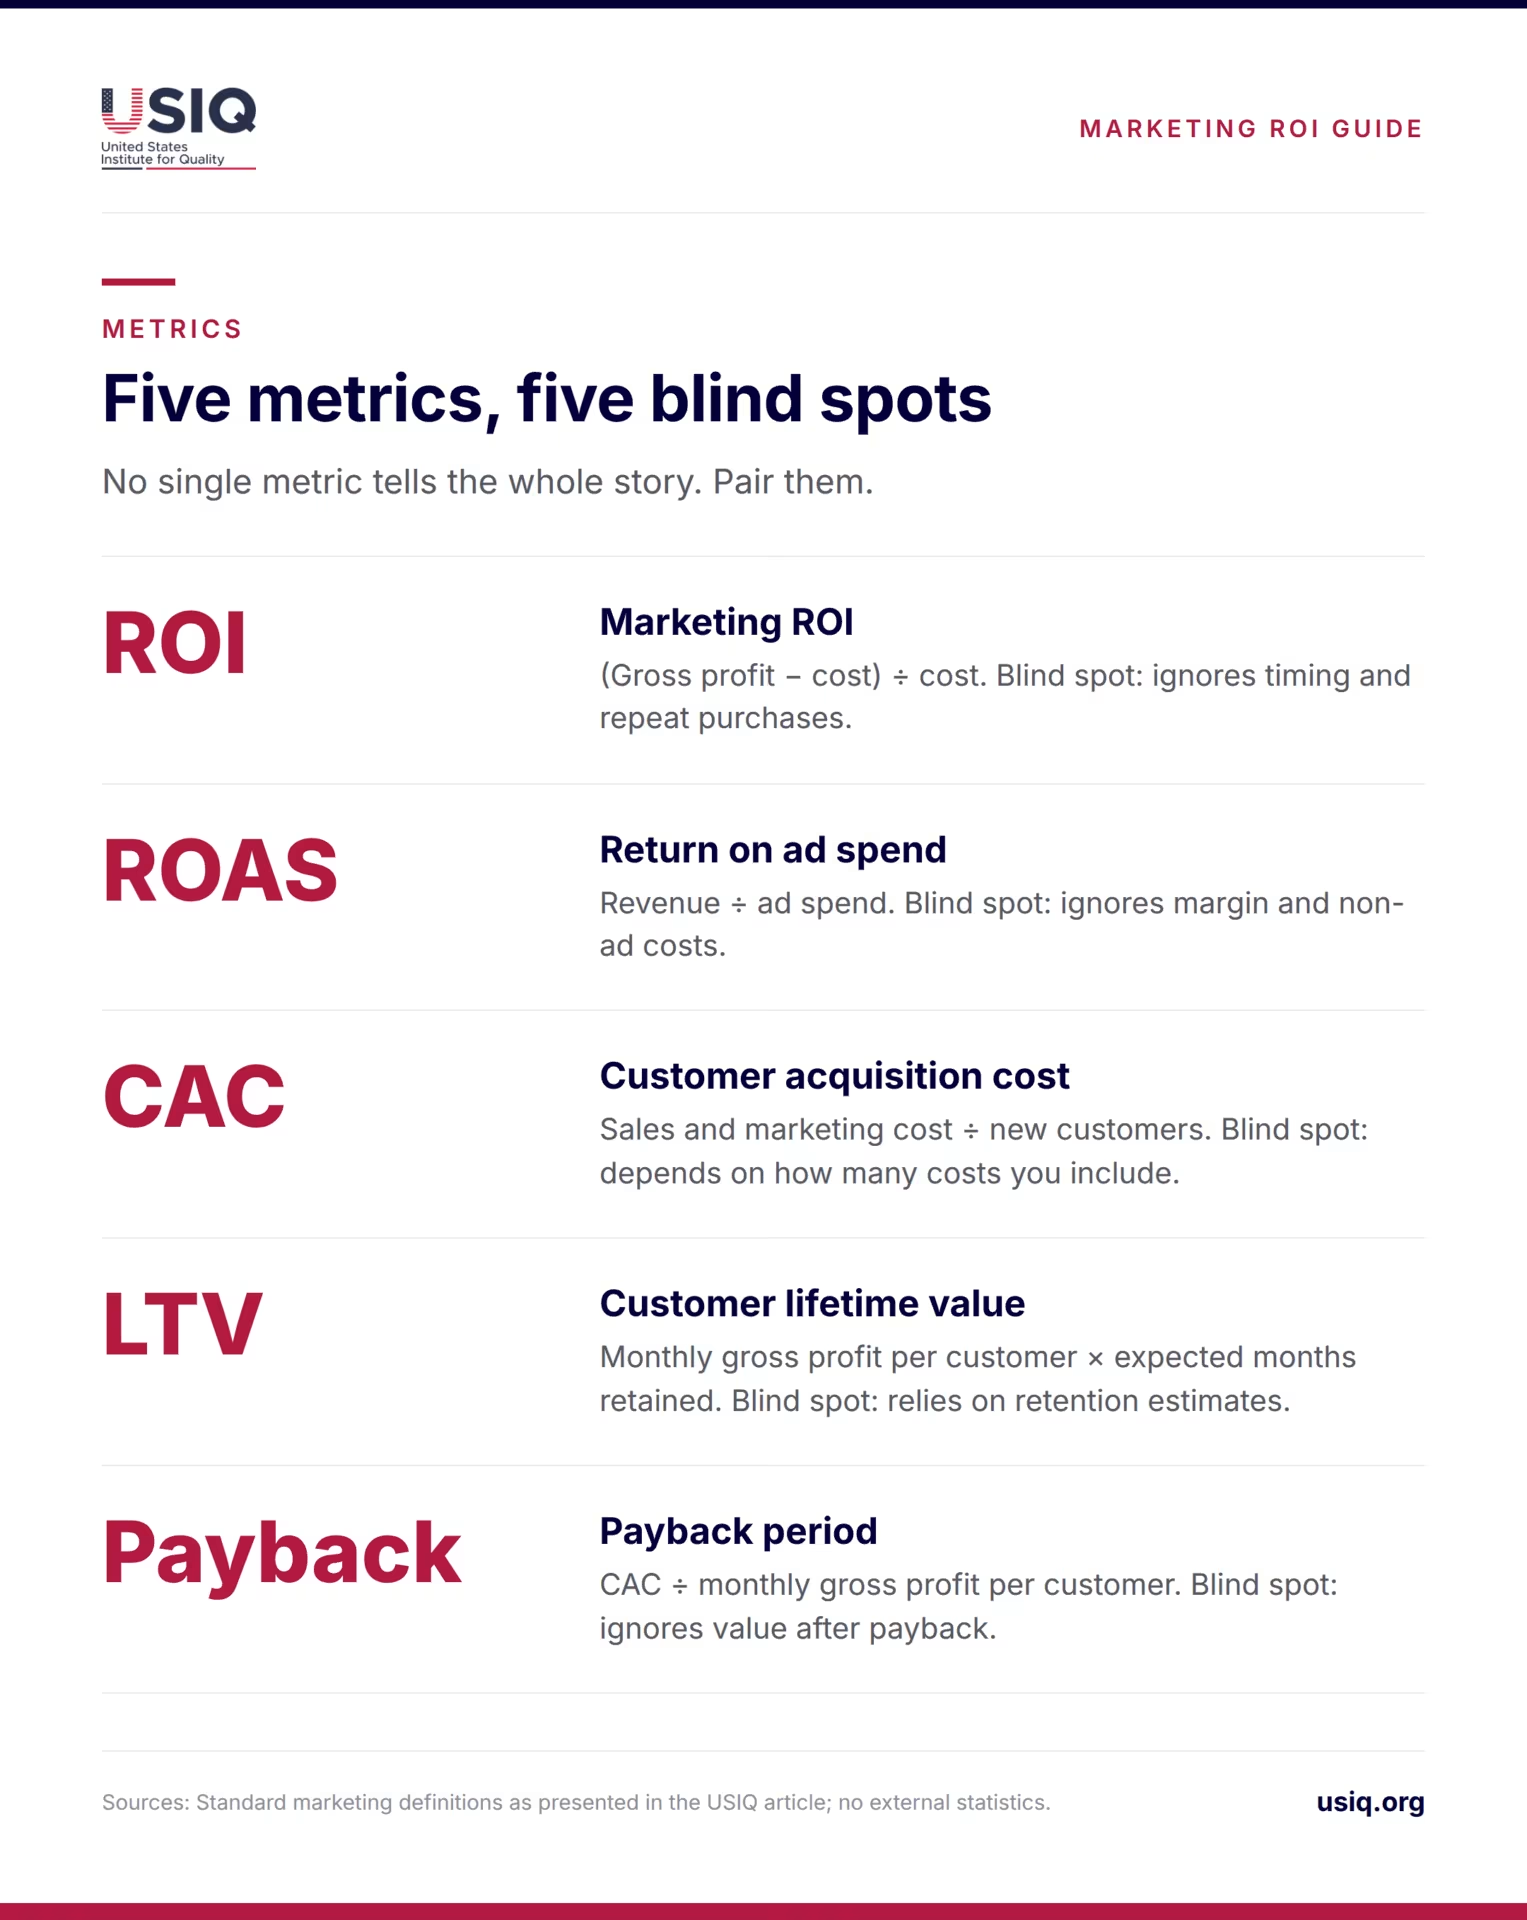
| Metric | Formula | Question it answers | Main blind spot |
|---|---|---|---|
| Marketing ROI | (Gross profit − cost) ÷ cost | Did this spend earn a profit? | Ignores timing and repeat purchases |
| ROAS | Revenue ÷ ad spend | How much revenue per ad dollar? | Ignores margin and non-ad costs |
| CAC | Sales and marketing cost ÷ new customers | What does one new customer cost? | Depends on how many costs you include |
| LTV | Monthly gross profit per customer × expected months retained | What is a customer worth? | Relies on retention estimates |
| Payback period | CAC ÷ monthly gross profit per customer | How fast does cash return? | Ignores value after payback |
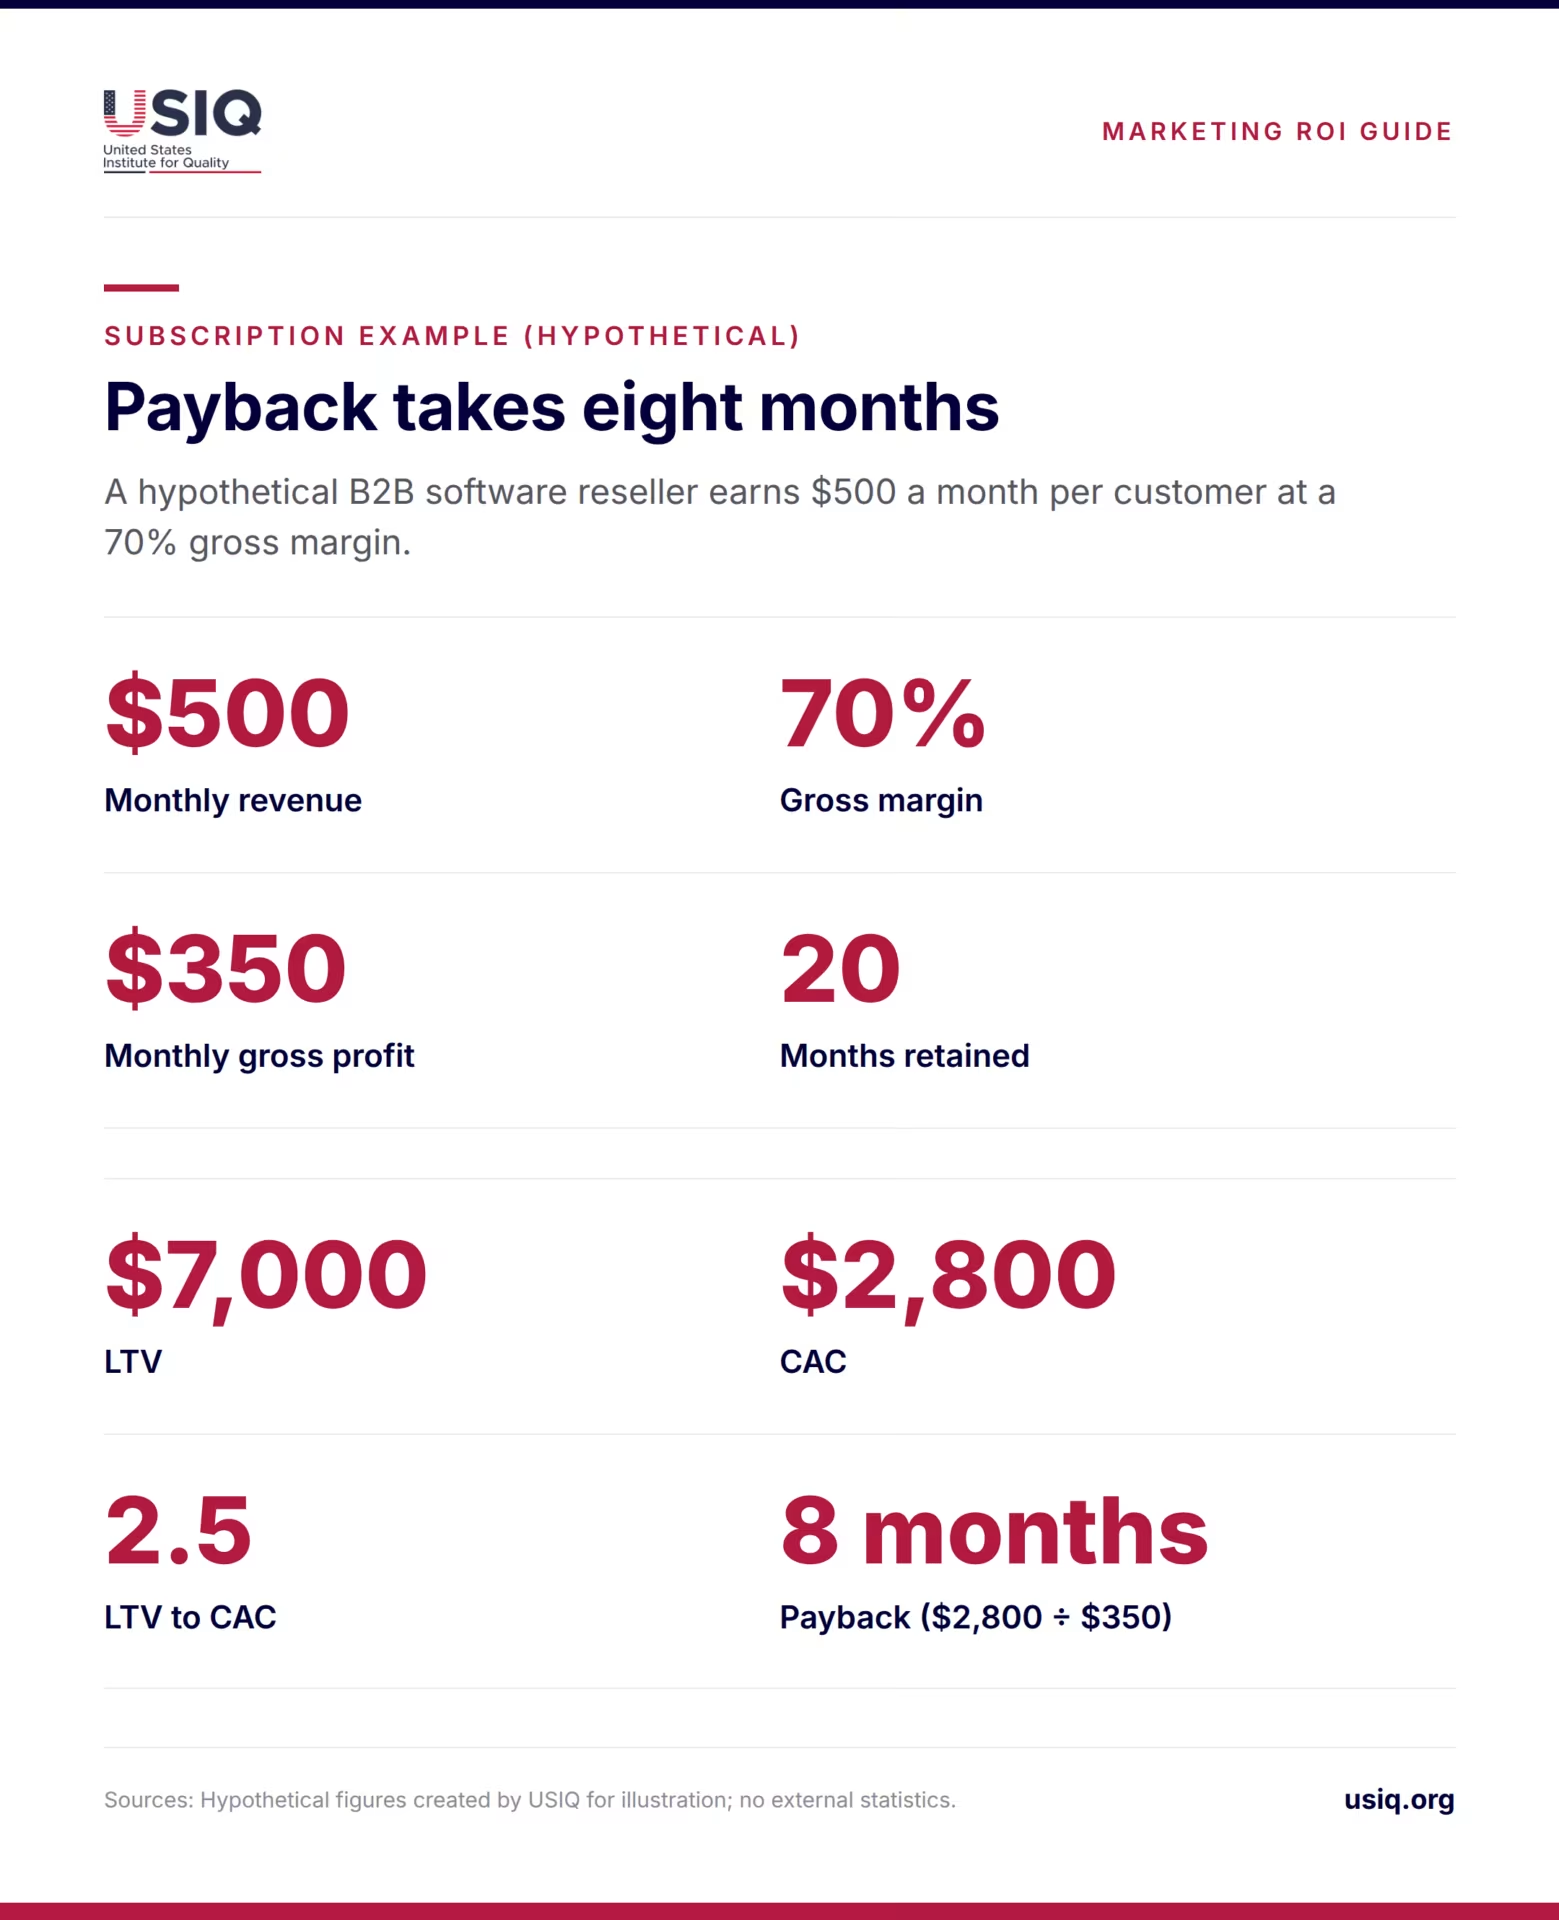
Here is a hypothetical subscription example. A B2B software reseller earns $500 a month per customer at a 70% gross margin, so gross profit is $350 a month. Customers stay 20 months on average, giving an LTV of $7,000. If CAC is $2,800, LTV to CAC is 2.5 and payback takes eight months ($2,800 ÷ $350).
Whether eight months is acceptable depends on cash, not on a rule of thumb. A company with thin reserves may not be able to wait eight months for each cohort to pay back, even if the ROI looks attractive on paper. A firm with steady cash flow can accept a longer payback. Set a payback limit that matches your own working capital.
How do you measure marketing ROI when B2B sales cycles are long?
When a deal takes six months to close, a campaign run in January shows almost no revenue by February. A monthly ROI report will call it a failure when it may simply be early. The fix is to stop matching spend and revenue within the same month.
Review by cohort
Group leads by the month they first came in, then follow each group until deals close or die. Compare the January cohort’s cost with the gross profit it eventually produces, whenever that happens. Update the cohort every month. After a few cycles you will know your own typical delay, which is more useful than any industry average.
Track pipeline stages as leading indicators
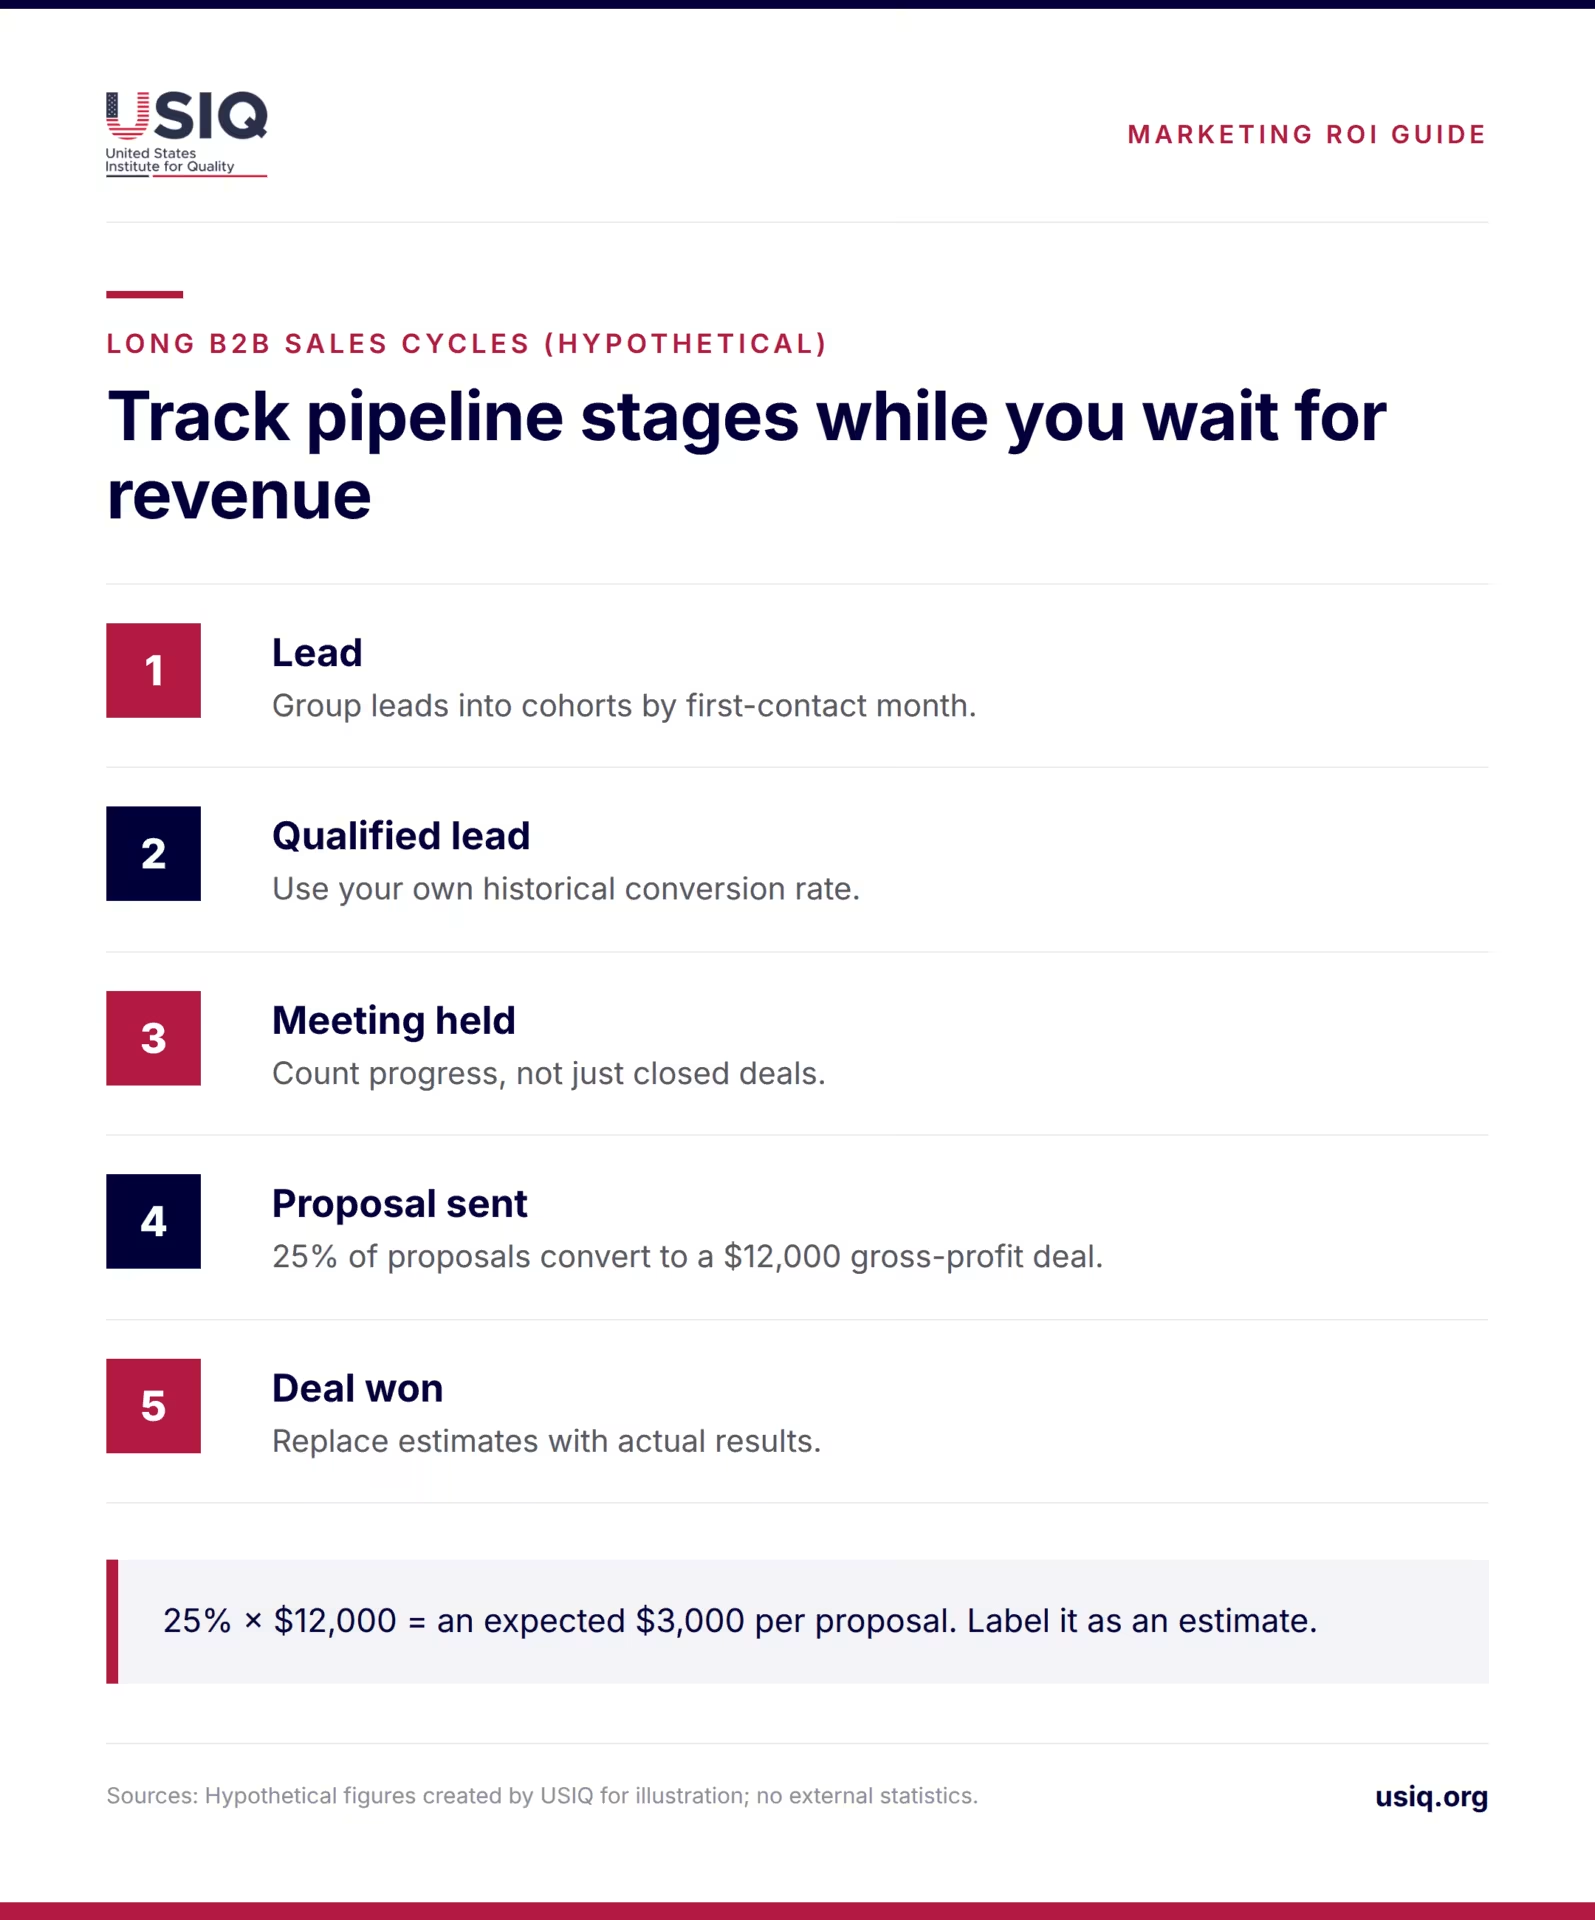
While you wait for closed revenue, count progress through stages: lead, qualified lead, meeting held, proposal sent, deal won. From your own records, work out what share of each stage historically becomes a win and the average gross profit per win. A proposal stage that converts 25% of the time to a $12,000 gross-profit deal is worth an expected $3,000 per proposal. Label this as an estimate and replace it with actual results once deals close.
Two cautions apply. Small companies close few deals, so one large win or loss can swing a conversion rate sharply, and a rate built on a handful of deals should not be treated as reliable. And buying committees mean several people touch your marketing before anyone signs, so a single “source” field in the CRM understates the influence of content, events and referrals that came earlier.
How do you track offline, local, call and referral leads?
Many small businesses win customers by phone, in person or through word of mouth, where no pixel can follow the trail. You can still attach a source to most of these leads if you build the habit into intake.
| Channel | Tracking method | Strength | Weak point |
|---|---|---|---|
| Print, radio, direct mail | Unique phone number, web address or promo code per campaign | Clear link from a campaign to a lead | Customers who ignore the code |
| Website and ads | Call tracking numbers, form source fields | Captures phone leads from online visits | Monthly tool fee, setup work |
| Referrals | Referral field in the CRM, named referrer, reward code | Shows an often high-value source | Staff forget to record it |
| Walk-ins and events | Sign-in sheet, coupon, “how did you hear about us” question | Works without technology | Relies on customer memory |
| Local sponsorships | Dedicated landing page, QR code, offer code | Gives a rough response count | Brand effects go unmeasured |
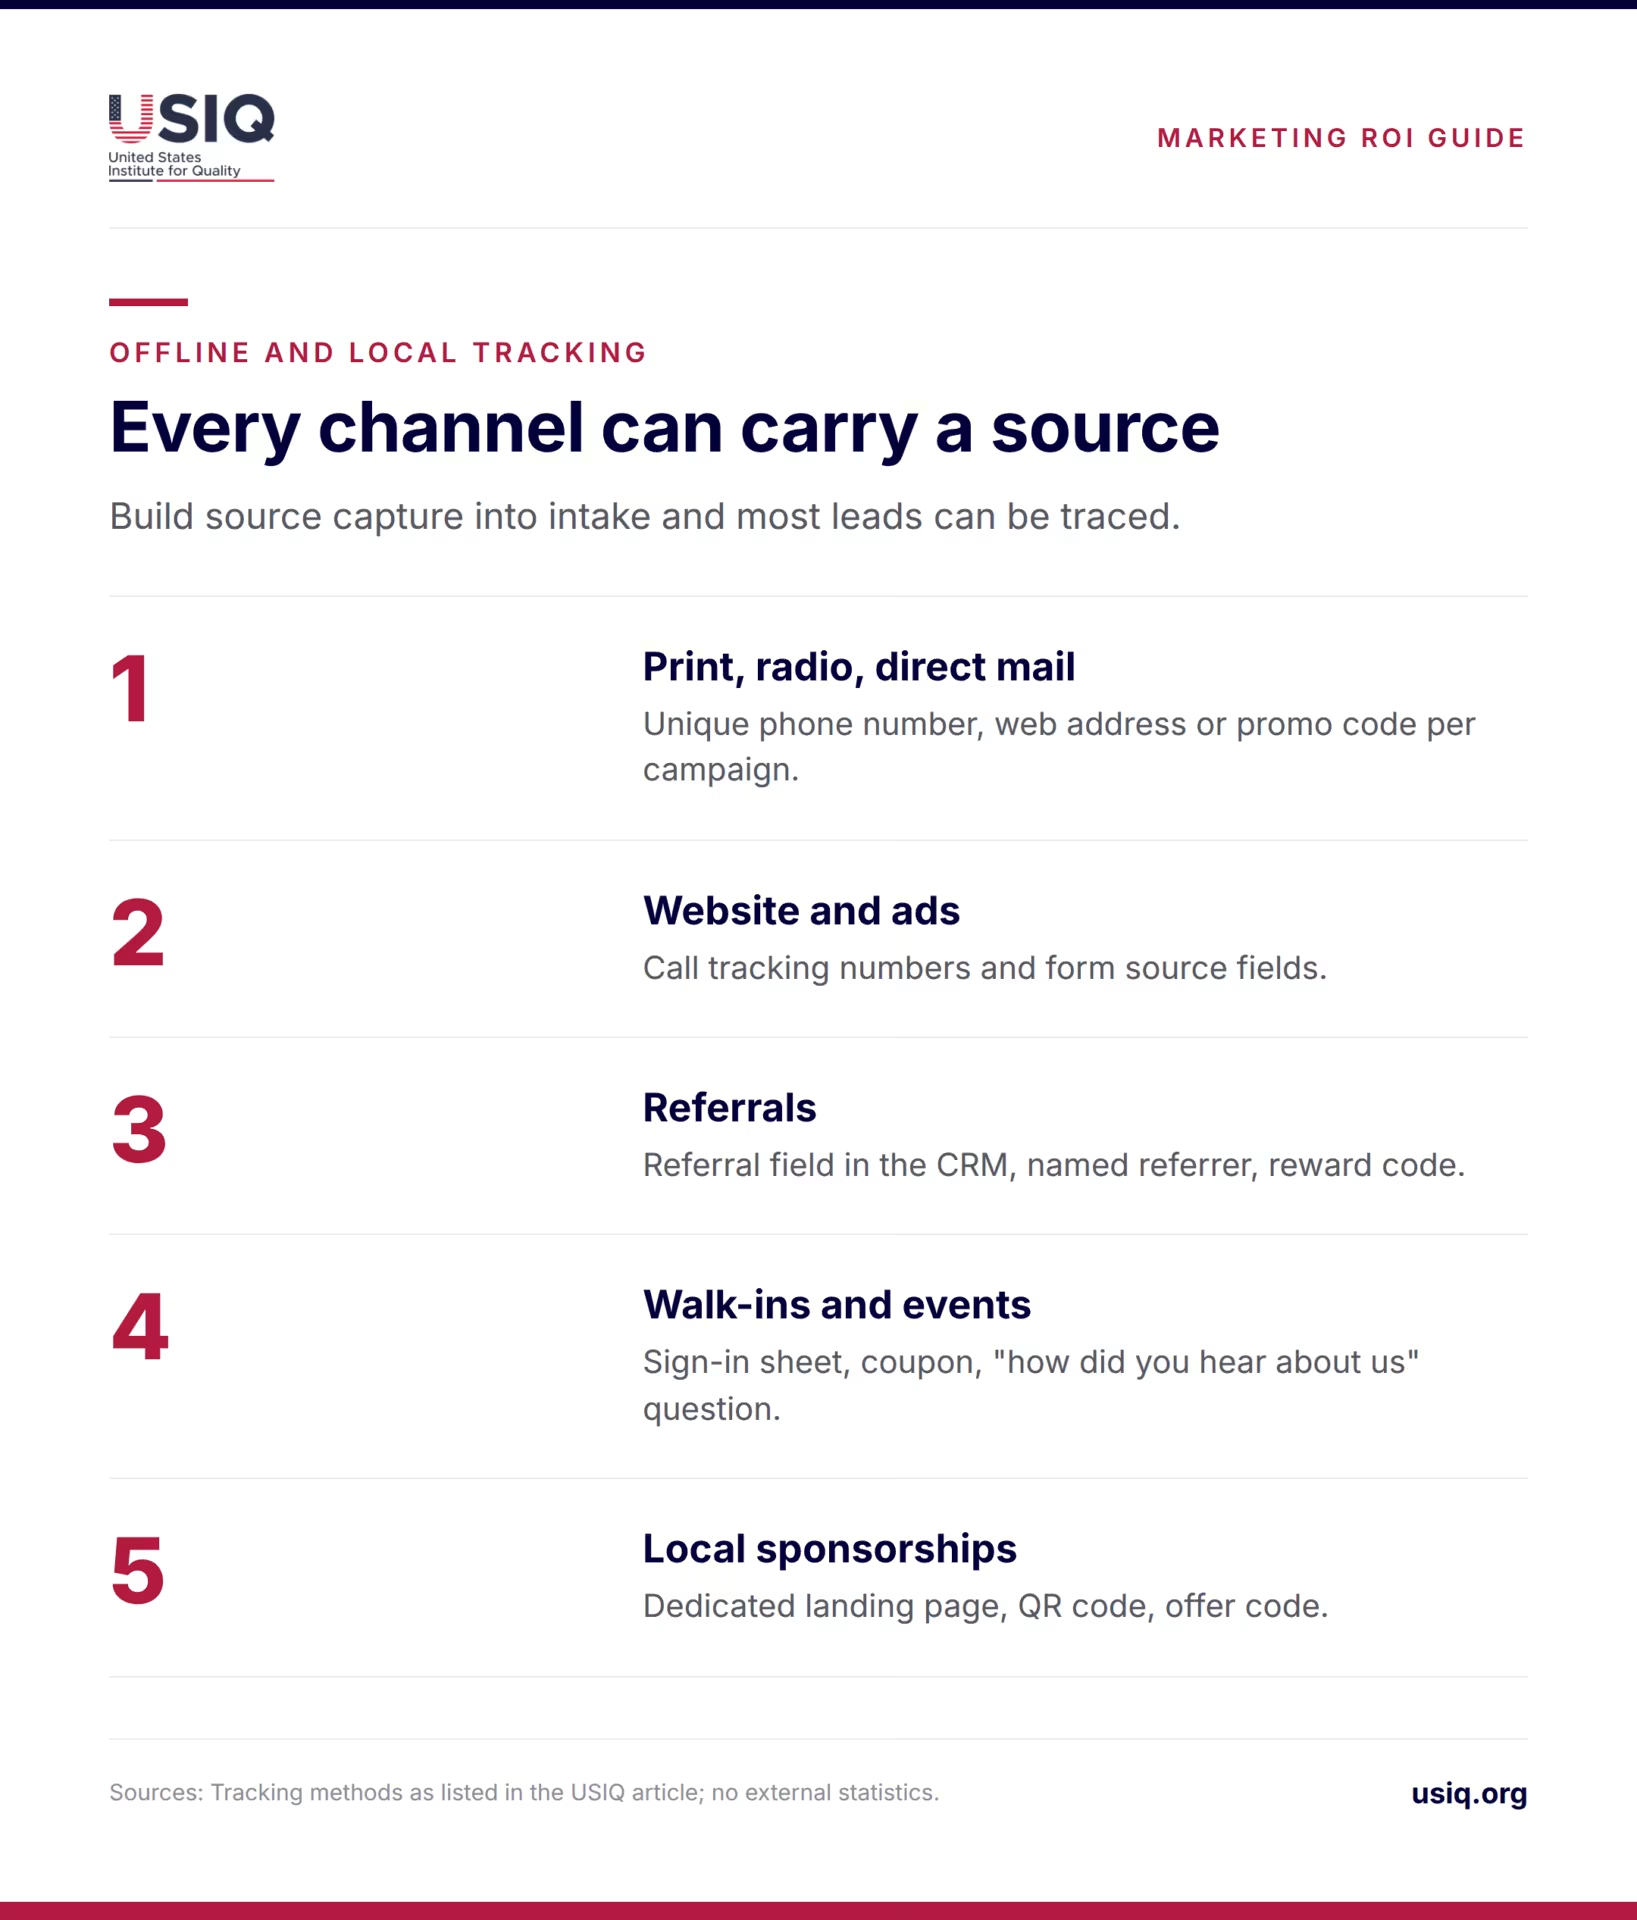
Make the “how did you hear about us” question a required field for whoever answers the phone or books the job, and give the answers a fixed list (for example: search, referral, mailer, sign, social, other). Free-text answers are nearly impossible to total. Review the “other” category quarterly to find sources you have missed.
One legal point deserves attention. If your call tracking tool records conversations, state rules on consent to record calls differ, and some states require every party to agree. Check the rules with a qualified attorney before turning recording on, and use a clear notice at the start of calls. Counting calls and capturing the source does not require recording them.
Which simple attribution method should a small business use?
Attribution assigns credit for a sale to one or more marketing touches. Enterprise software offers complicated models, but small companies with a few channels and a modest lead volume rarely need them. Three simple methods cover most cases.
| Method | How it works | Best for | Limit |
|---|---|---|---|
| First touch | Credits the first recorded contact | Judging what creates awareness and new leads | Ignores what closed the deal |
| Last touch | Credits the final contact before the sale | Short sales cycles, direct-response ads | Over-credits branded search and email |
| Self-reported | Customer states how they found you | Local, referral and phone-driven firms | Memory is imperfect |

A practical approach is to record both a system-captured source (first touch from your forms, call numbers or links) and a self-reported source on every lead. When the two agree, you can be fairly confident. When they differ, the gap itself is informative: a customer who “found you through a friend” after clicking a search ad may have needed both.
Privacy tools, browser restrictions and consent choices mean ad platforms can see only part of what customers do, and the conversion counts they report may be incomplete or modeled. Treat these numbers as a claim to check against your CRM and your bank deposits rather than as proof. If a platform says a campaign produced 30 sales and your invoices show 18, trust the invoices.
What is a good marketing ROI for a company your size?
Many articles quote a single “good” ROI figure. This guide does not. A number that is not tied to your margin, sales cycle and industry can mislead more than it helps, and no reliable benchmark by company size was available for this article. Set your own baseline instead.
- Start with margin. A channel needs at least enough gross profit to cover its cost. For a business with a 20% margin, a ROAS under 5 cannot break even on ad cost alone.
- Use your own history. Take the last 12 months of spend and customers by channel. Your median CAC and payback are your baseline, and improvement against it is the real goal.
- Adjust for size. A one-person firm may do all its marketing itself, so the labor cost is mostly the owner’s time. Count it at a realistic hourly rate. A company with 50 employees will have staff, agencies and tools to include.
- Adjust for the business model. Repeat-purchase and subscription firms can accept a lower first-sale ROI because of LTV. One-time purchases need the first sale to pay for itself.
Be cautious about published benchmarks from software vendors and agencies. Ask who collected the data, how many firms were included and whether they resemble yours.
How do you build a marketing ROI spreadsheet?
A spreadsheet is enough for most small businesses. Build one row per channel per month, or per cohort for long sales cycles, with these columns: channel, total cost, leads, customers, revenue, gross profit, ROI, CAC and payback.
Step-by-step setup
- List every channel and give each one a fixed source label that matches the CRM or intake form.
- Enter total cost per channel: invoices, tool fees and the labor share. Keep a note of how you allocated shared costs.
- Count leads and new customers from your CRM or booking records, not from the ad platform.
- Enter revenue from invoices, then apply your actual gross margin to get gross profit.
- Add formulas: ROI = (gross profit − cost) ÷ cost; CAC = cost ÷ customers.
- Add a totals row, plus a row for unattributed customers so the figures reconcile with total sales.
Here is a hypothetical month for one company:
| Channel | Total cost | Customers | Revenue | Gross profit | ROI | CAC |
|---|---|---|---|---|---|---|
| Search ads | $4,000 | 10 | $20,000 | $8,000 | 100% | $400 |
| $600 | 4 | $6,000 | $2,400 | 300% | $150 | |
| Referral rewards | $1,000 | 5 | $9,000 | $3,600 | 260% | $200 |
| Local sponsorship | $2,500 | 2 | $3,500 | $1,400 | −44% | $1,250 |
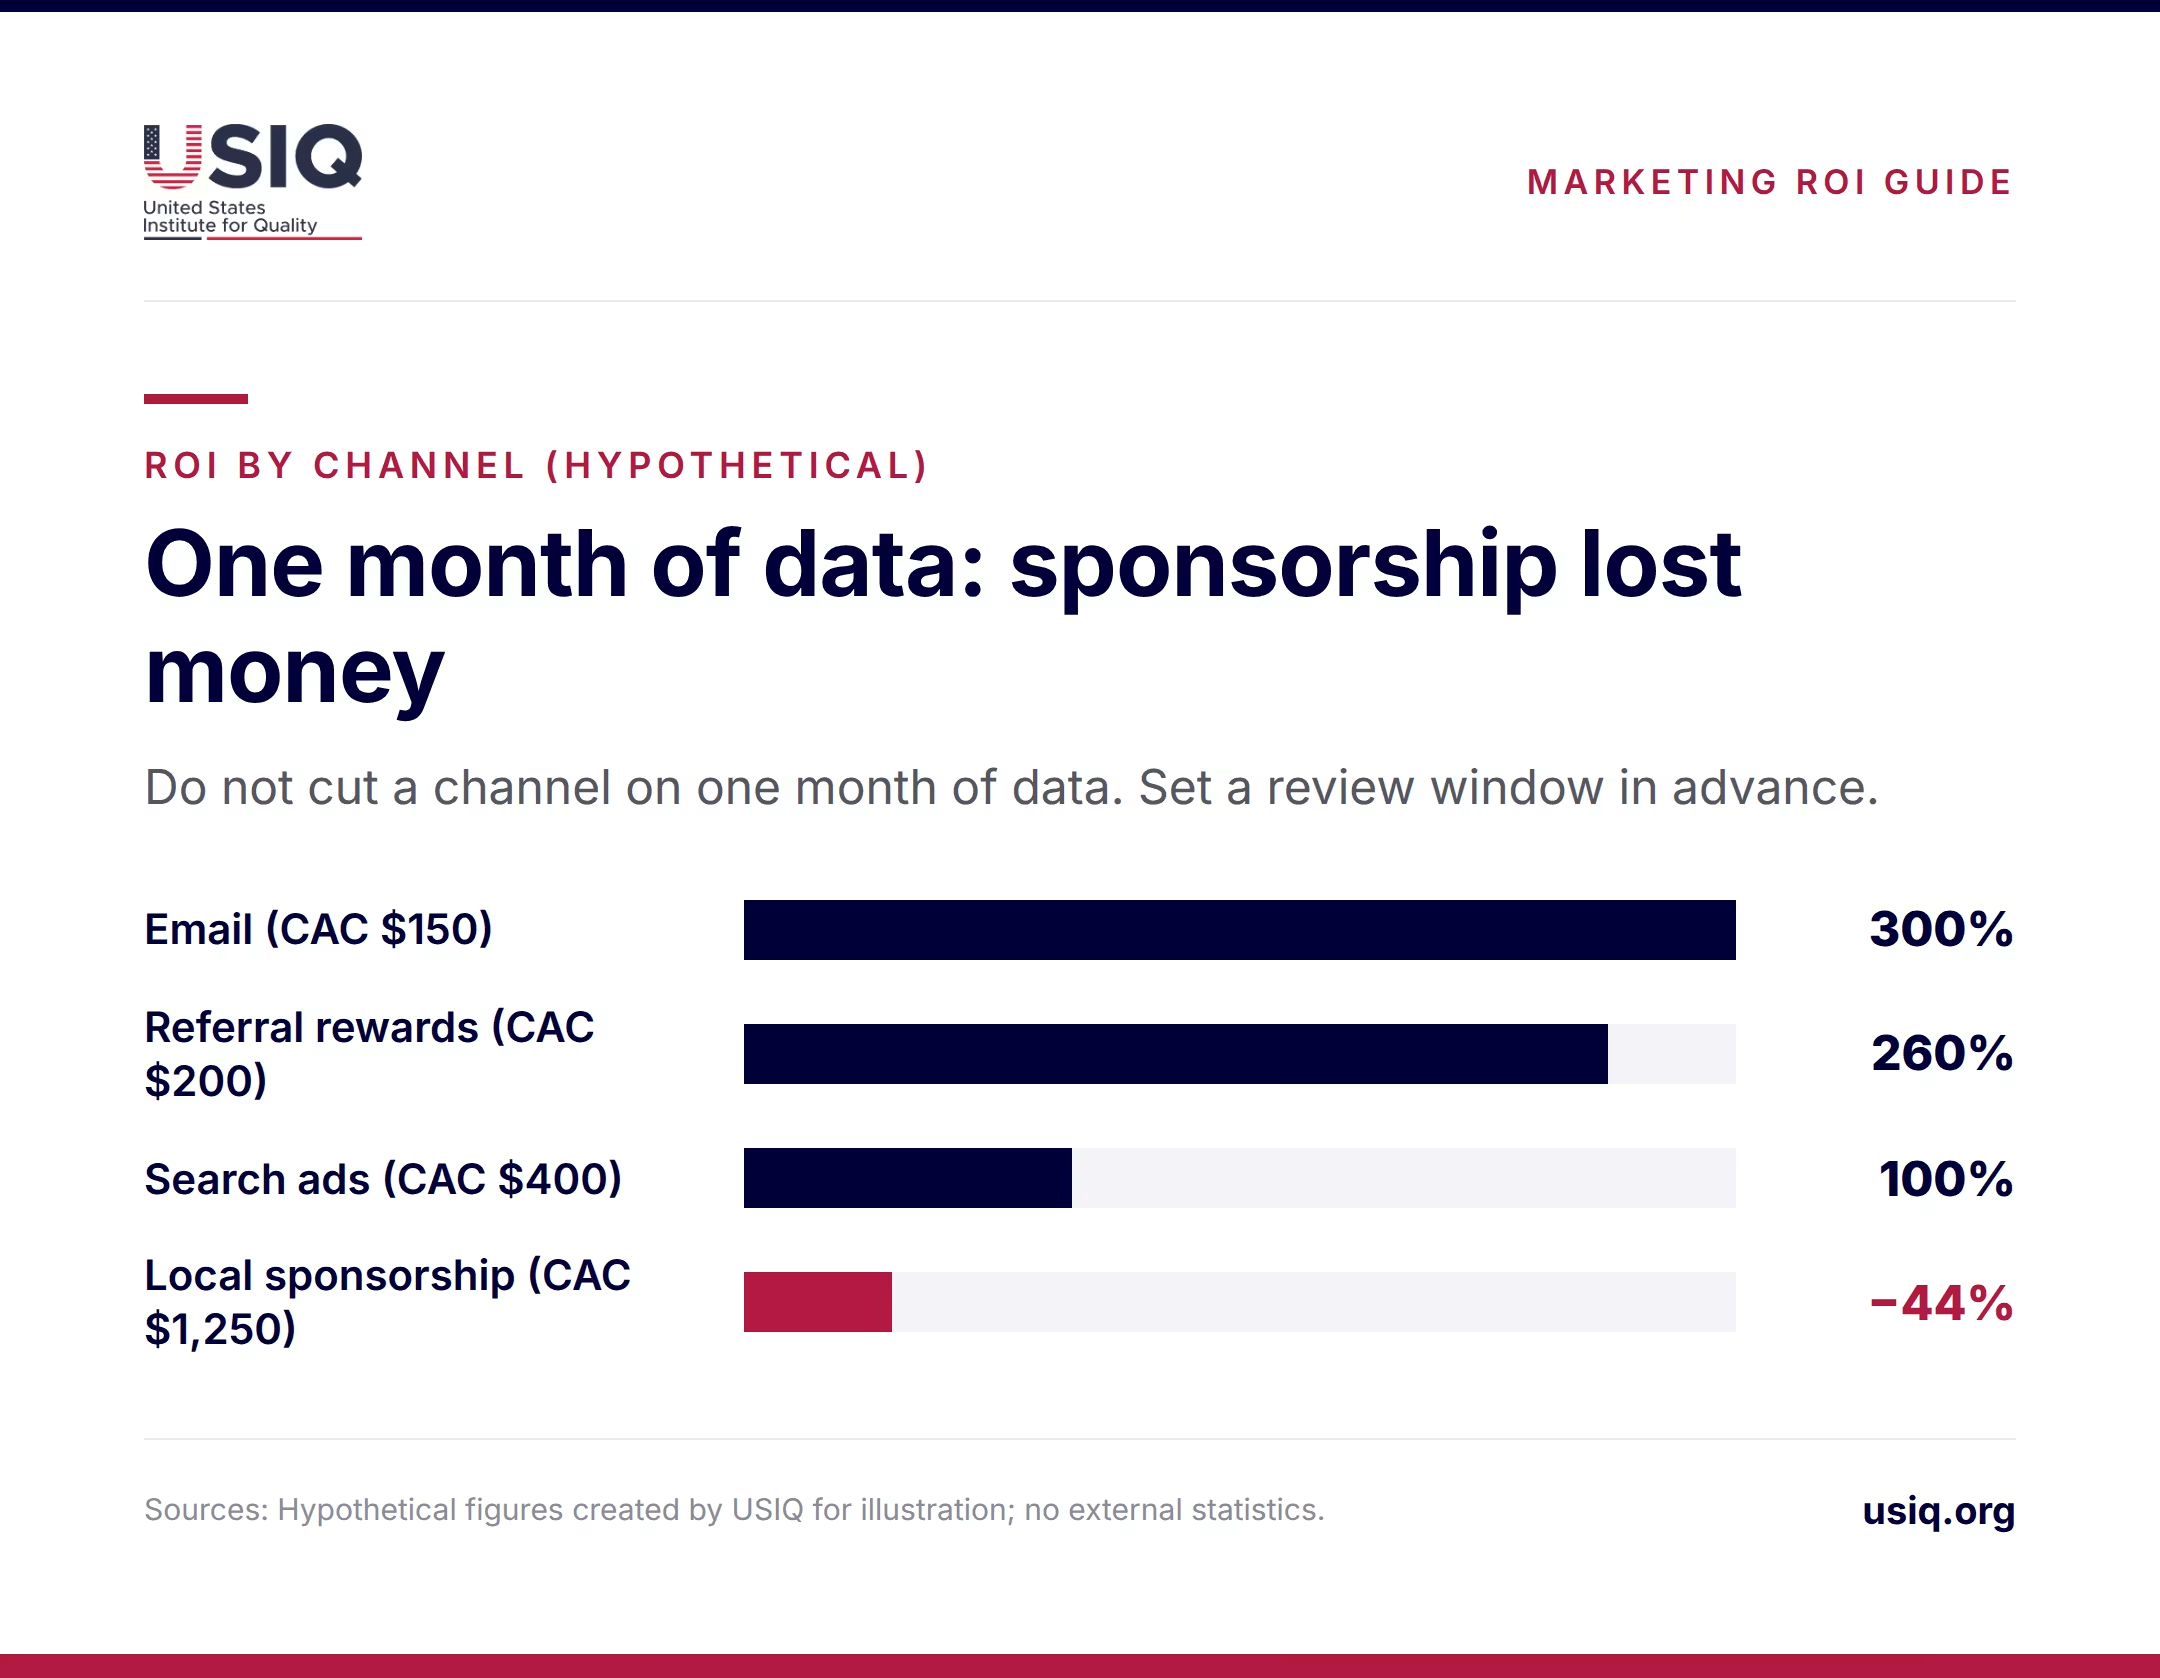
Read the table carefully before acting on it. Email looks best, but email mostly converts people who already know the company, so it may be harvesting demand that search ads or referrals created. The sponsorship lost money this month, yet it may have built local recognition that helps other channels. Do not cut it on one month of data. Decide on a review window (for example, two quarters), set a goal for it in advance and judge it then.
How should you report marketing ROI to leadership?
Leaders want to know what to do next, not to read every column. A one-page monthly report works well: total spend, new customers, blended CAC, ROI by channel, payback and one paragraph that says what you will change.
- State assumptions openly. Show the gross margin used, how labor was allocated and which attribution method applies.
- Separate short-term and long-term results. Show direct-response channels on a monthly basis and brand, content and events on a cohort or quarterly basis.
- Reconcile with the books. Total attributed revenue plus unattributed revenue should equal actual sales. Finance will trust the report more.
- Show uncertainty. When a channel has fewer than a handful of customers, say the result is too small to be reliable.
- End with a decision request. Increase, hold, test or stop, each with a reason and a review date.
For context on which channels small firms are currently testing, see USIQ’s overview of current marketing trends for small businesses. Teams building in-house skills can also look at marketing courses worth considering.
What are the most common marketing ROI mistakes?
- Using revenue instead of profit. This overstates returns, particularly for low-margin businesses.
- Ignoring labor and tools. The ad invoice is rarely the whole cost.
- Judging too soon. Long sales cycles and brand work need cohort views, not a single month.
- Double-counting. If the platform, the email tool and the CRM each claim the same sale, total attributed revenue exceeds actual sales. Reconcile against invoices.
- Trusting vendor-reported numbers. Platforms have an incentive to show strong results and see only part of the customer path.
- Cutting what you cannot measure. Absence of tracking is not evidence of failure. Test with a controlled pause or a regional comparison when possible.
- Ignoring existing customers. Repeat sales and referrals from past customers often belong in the ROI of earlier marketing.
What are the limits of marketing ROI?
ROI is a useful discipline but not a complete truth. Brand awareness, reputation and word of mouth build slowly and are only partly visible in any source field. A business that cuts every channel with a weak measured ROI can slowly dry up the demand its best-measured channels depend on.
Small samples add noise. Ten customers a month cannot support fine distinctions between channels. And ROI cannot tell you whether a campaign was the best option available, only whether it paid off. Keep a small test budget for new channels and judge it against a stated goal, not against mature channels.
What should you do first?
- Confirm your true gross margin with your accountant, since every ROI calculation depends on it.
- Create a fixed list of lead sources and make source capture mandatory in the CRM, booking tool and phone script.
- Set up unique numbers, codes or links for each offline campaign.
- Build the spreadsheet above and fill in the last 12 months to find your baseline CAC and payback.
- Choose a payback limit that fits your cash position.
- If your sales cycle is long, switch to cohort reporting and pipeline-stage tracking.
- Reconcile marketing figures with invoices every month and review results quarterly.
The bottom line
Measuring marketing ROI does not require expensive software. It takes profit-based math, honest cost counting, consistent source tracking and patience with long sales cycles. Start with one spreadsheet, reconcile it with your invoices, and use your own data rather than a generic benchmark to decide where the next dollar goes.
Frequently asked questions
What is the formula for marketing ROI?
Marketing ROI is (gross profit attributable to marketing − total marketing cost) ÷ total marketing cost, expressed as a percentage. Use gross profit rather than revenue so product costs are covered, and include ad spend, agency fees, software and labor in the cost. A result of 100% means each dollar returned itself plus one dollar of profit.
Is ROAS the same as ROI?
No. ROAS divides revenue by ad spend and ignores margin, labor and tool costs. ROI uses profit and total cost. A campaign can show a high ROAS and still lose money if margins are thin. Use ROAS to compare ads with similar margins, and ROI for budget and reporting decisions.
How do I measure ROI on marketing that does not produce instant sales?
Group leads into monthly cohorts and follow each one until deals close. Compare each cohort’s cost with the gross profit it eventually produces. In the meantime, track pipeline stages such as qualified leads and proposals, and apply your own historical conversion rates to estimate expected value, labeling these as estimates.
How can I track leads from referrals and phone calls?
Use call tracking numbers for each campaign, promo or referral codes, and a required source field in your CRM or booking tool. Train staff to ask how each customer found you and to pick from a fixed list. Review the “other” answers regularly to find sources you are missing.
Do I need to record calls to use call tracking?
No. Call tracking can count calls and capture the source without recording the conversation. If you do record calls, consent rules differ by state and some require all parties to agree. Ask a qualified attorney about the rules in the states where you operate, and give callers a clear notice.
Why do ad platform numbers differ from my sales records?
Platforms see only part of the customer path, privacy settings and consent choices limit what they can observe, and several tools may claim credit for the same sale. Offline conversions, such as phone orders, often go uncounted. Treat platform figures as a claim, and reconcile them with your CRM and invoices.
How often should I review marketing ROI?
Review direct-response channels monthly and brand, content and event spending quarterly or by cohort. Reviewing too often on small samples produces noise, while reviewing too rarely lets weak channels run. Set the review date and the success measure before launching a test so the decision is not made after the fact.
Sources
The formulas in this article are standard definitions, and all dollar figures are hypothetical examples created for illustration. Related reading on USIQ:
- Best Courses for Marketing in 2025, USIQ: https://www.usiq.org/blog/best-courses-for-marketing-you-should-look-for/


Related Articles
Employee experience and customer experience are linked, but the link is weaker and more conditional than popular slogans suggest. This article reviews the evidence on staffing, training and workplace conditions and shows how employers can test the connection in their own business.
Most HR dashboards show too many metrics and trigger too few decisions. This guide defines ten employee experience metrics, shows a one-page layout and explains how to read your numbers against U.S. data.

Engagement at the workplace means how connected people feel to their jobs and the company they work for. It is [...]
In today's labor market of the US, the term best organization to work for has come to mean those employers [...]